← Back to the plain-language case
Abstract reports WGS spanned 49 (98%) of 48 P-VNTRs; the body gives 92% and 45
PLoS Comput Biol (2025) · doi:10.1371/journal.pcbi.1012885 · PMC11975116
Summary
The paper compares targeted and whole-genome (WGS) PacBio HiFi sequencing for genotyping a curated set of 48 phenotype-associated VNTRs (P-VNTRs). The Abstract says the WGS data spanned "49 (98%) of P-VNTRs with at least 15 spanning reads". That count cannot be right, because 49 of 48 is 102.1%. The body gives two other values for the same quantity: 92% (Results 2.5.2 and the Discussion) and "45 VNTRs (out of 48)" (Discussion), which is 93.75%, not 92%. The best-supported figure from the paper's own text is 45 of 48 (about 94%). The Abstract's 98% therefore overstates WGS coverage of the P-VNTR set by roughly 4 to 6 percentage points. The paper's comparison with targeted sequencing (4 of 48) is unaffected.
What the paper reports
In contrast, the 40X WGS HiFi dataset spanned 98% of all VNTRs and 49 (98%) of P-VNTRs with at least 15 spanning reads, albeit with lower coverage.
— Abstract
Similar to G-VNTRs, whole genome sequencing covered 92% of P-VNTRs with median spanning coverage ≥ 15 spanning reads in 28 samples (Fig 3b). CACNA1C, DUX4 and ABCA7 VNTRs were not well-covered likely due to VNTR length.
— Results, section 2.5.2
In contrast, whole genome sequencing was unbiased with at least 15 spanning reads for 98% of G-VNTRs and 92% of the P-VNTRs. For P-VNTRs, the gap in spanning reads between the two sequencing methods was even more stark, with only 4 VNTRs in targeted sequencing and 45 VNTRs (out of 48) in whole genome sequencing supported by at least 15 spanning reads.
— Discussion, paragraph 1
The size of the P-VNTR set is stated, and adds up to 48, in several places:
We curated a set of 10 , 787 gene-proximal (G-)VNTRs, and 48 phenotype-associated (P-)VNTRs of interest.
— Abstract (the spacing in "10 , 787" is as archived)
The P-VNTRs includes 39 pathogenic and 9 non-pathogenic phenotype-associated loci.
— Fig 3 legend, panel (a)
However, 19 (39%) of 48 P-VNTRs had high repeat-unit count (RC) variation, … Another 21 had low RC variation, while the remaining 8 VNTRs associated with phenotypes based not on length but on the presence of specific motifs …
— Results, section 2.5
Only 4 VNTRs of the 48 P-VNTRs were spanned by ≥ 15 targeted spanning reads.
— Results, section 2.5.1
What the paper's own numbers show
Method: take the denominator the paper states (48 P-VNTRs, confirmed by 39 + 9 and by 19 + 21 + 8). Convert each reported count to a percentage, and each reported percentage to the count it implies over 48. Then compare these with the count implied by the three loci that Results 2.5.2 names as not well covered. All arithmetic is in recompute.py.txt.
| Quantity | Location | Reported | Recomputed from the paper's own numbers |
|---|---|---|---|
| Size of the P-VNTR set | Abstract; Results 2; Fig 3a legend; Results 2.5; Discussion | 48 | 39 + 9 = 48; 19 + 21 + 8 = 48 |
| P-VNTRs spanned by ≥ 15 WGS reads (count) | Abstract | 49 | 49/48 = 102.08%, which exceeds the whole set |
| Same quantity (percentage) | Abstract | 98% | 0.98 × 48 = 47.04, i.e. 47/48 = 97.92%. This is neither 49 nor any count in the body |
| Same quantity (percentage) | Results 2.5.2; Discussion | 92% | 0.92 × 48 = 44.16, i.e. 44/48 = 91.67% |
| Loci named as not well covered by WGS | Results 2.5.2 | CACNA1C, DUX4, ABCA7 | 48 − 3 = 45, i.e. 45/48 = 93.75% (rounds to 94%) |
| Same quantity (count) | Discussion | 45 (out of 48) | 45/48 = 93.75%. The same paragraph says 92% |
| Abstract overstatement, in percentage points | Abstract vs body | — | 98 − 93.75 = 4.25 (vs 45/48); 98 − 91.67 = 6.33 (vs 44/48) |
| P-VNTRs spanned by ≥ 15 targeted reads | Abstract; Results 2.5.1; Discussion | 4 (8%) | 4/48 = 8.33%, consistent |
| High-RC P-VNTRs | Results 2.5 | 19 (39%) | 19/48 = 39.58% (would round to 40%), a minor rounding slip |
| Low-RC + motif P-VNTRs | Results 2.5 | 29 (60% of 48) | 29/48 = 60.42%, consistent |
The paper's statements give three different counts for one quantity: 49 (Abstract), about 44 (the 92% in Results and Discussion) and 45 (Discussion). Only 45 agrees with the three loci the Results names as poorly covered. No count over 48 can produce both "49" and "98%".
Figure
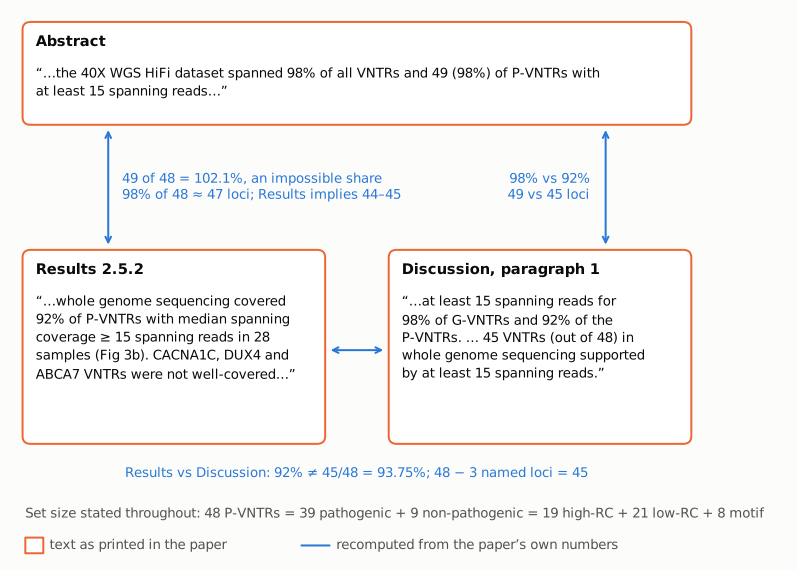
Figure 1. Three passages of the paper, quoted verbatim (orange boxes), report WGS coverage of the same 48 P-VNTRs at the same threshold (at least 15 spanning reads). The blue connectors give the arithmetic from the paper's own numbers. The Abstract's "49" is larger than the set (49/48 = 102.1%), and its 98% would correspond to 47 loci. Results gives 92% (about 44 loci) but names three loci as not well covered, which implies 45. The Discussion gives both 92% and 45 of 48 (93.75%). The set size of 48 is stated and adds up consistently throughout the paper.
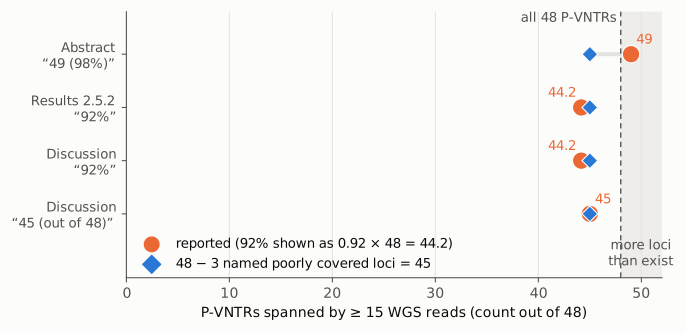
Figure 2. Each reported value expressed as a count out of 48 (orange circles; the 92% statements are shown as 0.92 × 48 = 44.2), set against 45, the count left after removing the three loci that Results 2.5.2 names as not well covered (blue diamonds). The dashed line marks the whole set of 48, and the shaded region holds counts larger than the set. Only the Abstract's value falls there. The axis starts at zero.
Why it matters
The Abstract is the part of the paper most readers see and cite, and it states a P-VNTR count that is larger than the P-VNTR set. Its 98% looks plausible on its face, so a reader who does not check it against the stated set size of 48 would take WGS coverage of the clinically relevant loci to be about 4 to 6 points higher than the body supports. The 98% also matches the G-VNTR figure in the same sentence, which makes WGS look equally complete for both sets. The body itself says otherwise: three named loci (CACNA1C, DUX4, ABCA7) were not well covered, largely because of their length.
The error does not change the direction of the paper's main comparison. Every value the body supports (44 or 45 of 48, 92% to 94%) remains far above targeted sequencing (4 of 48, 8.3%). The paper's conclusion that WGS is more effective for broad VNTR genotyping stands. The G-VNTR figure (98% of 10,787) is reported consistently and is not affected. The problem is an impossible count, and an inflated percentage, in the Abstract for a secondary result. There is also a smaller internal inconsistency (92% vs 45/48) in the body.
Explanations considered
- A different denominator. The paper states 48 P-VNTRs everywhere, including in "45 VNTRs (out of 48)", and its subgroup counts (39 + 9; 19 + 21 + 8) both add up to 48. S2 Table has 49 rows but only 48 unique coordinates: one locus (MUC6) appears twice, and the table flags it as a duplicate entry because it is linked to both a pathogenic and a non-pathogenic phenotype. With 49 as the denominator, 92% would fit 45/49 (91.84%) and 98% would fit 48/49 (97.96%). But the abstract's "49" would then mean 49/49 = 100%, not 98%. So no single denominator reconciles "49 (98%)", and the paper never describes the set as 49 loci.
- A different coverage rule. The Abstract says "at least 15 spanning reads". Results says "median spanning coverage ≥ 15 spanning reads in 28 samples". Under any rule, at most 48 loci can meet the threshold, so 49 is impossible whichever definition was used. The Discussion uses the same threshold and the same WGS cohort, and its two adjacent figures (92% and 45 of 48) still disagree.
- Exclusions. CACNA1C is excluded only from the allele plot (Fig 3c), not from the coverage count. Results 2.5.2 counts it among the three loci that were not well covered.
- Rounding. 45/48 = 93.75% rounds to 94%, not 92%. 92% matches 44/48 (91.67%), but the text names exactly three poorly covered loci, not four. Rounding cannot turn 49 of 48 into a valid figure.
- Text conversion or archiving artifact. These are plain integers and percentages in running text, with no symbols, superscripts or table cells involved. The same wording appears in the publisher's HTML, the Europe PMC full-text XML and the PMC archive.
- Per-locus data. Fig 3b (a heatmap of spanning reads per locus and sample) holds the underlying data, but it cannot be read reliably as numbers. S2 Table lists coordinates and categories but not WGS read counts. The true count therefore cannot be settled beyond what the text implies, and the text's three named loci point to 45.
Status
- Version of record: checked on 2026-10-23. The publisher's HTML at journals.plos.org (reached through doi.org) has all three passages word for word, as do the Europe PMC full-text XML and the PMC archive. Every quotation above was checked verbatim against the archived PMC text.
- Supplements: S1 Table (PDF: genes, phenotypes, references), S2 Table (TSV: coordinates, category, pathogenicity), S3–S5 Tables (adapters, read-length summaries) and S1–S4 Figs are listed. S2 Table was downloaded and parsed: 49 rows, 48 unique coordinates and 1 flagged duplicate (MUC6). None of the supplements gives per-locus WGS spanning-read counts, so they do not resolve the discrepancy.
- Corrections: none found. Crossref shows no update-to or updated-by relations. PMC and Europe PMC have no correction, erratum, expression of concern or retraction notice (a Europe PMC correction query returned 0 hits). The PLOS article page shows no correction notice, and its comments tab shows "Reader Comments (0)".
- PubPeer: not confirmed. The PubPeer search API and search page returned a human-verification challenge (HTTP 403) on 2026-10-23. A web search found no PubPeer entry for the article.
- Sources: https://doi.org/10.1371/journal.pcbi.1012885; Europe PMC record PMID 40193344; PMC11975116; S2 Table, doi:10.1371/journal.pcbi.1012885.s002.
Status as of 2026-10-23.
Suggested correction
Replace "49 (98%) of P-VNTRs" in the Abstract with the count and percentage supported by the per-locus data behind Fig 3b, over the stated set of 48 P-VNTRs. If the three loci named in Results 2.5.2 are the only ones below the threshold, this would read "45 (94%) of P-VNTRs". Change the "92%" in Results 2.5.2 and in the Discussion to match (for example "94%", or "45 of 48"), so that the Discussion's "92%" and "45 VNTRs (out of 48)" agree. If the coverage rule in the Abstract ("at least 15 spanning reads") differs from the one in Results ("median spanning coverage ≥ 15 … in 28 samples"), state one rule and use it throughout. Optionally, also change "19 (39%)" in Results 2.5 to "19 (40%)".