← Back to the plain-language case
Population odds ratio of 45.2 for the RE5 variant does not follow from the stated counts
Circulation (2024) · doi:10.1161/CIRCULATIONAHA.124.069041 · PMC11670919
Summary
The paper reports that a rare SCN5A enhancer variant (RE5) was carried by 9 of 231 Thai patients with Brugada syndrome (BrS) and by 6 of 10 043 individuals in the Genomics Thailand database, and gives an odds ratio of 45.2 (95% CI 14.5–141.3, P = 5.6E-12) for that comparison; the Abstract cites 45.2 as the variant's odds ratio. From the stated counts the odds ratio is 67.8 (95% CI 23.9–192.2), by the same Wald method that reproduces the paper's other odds ratio (20.2 against study controls) to every digit. The printed P value matches the stated counts exactly, whereas the printed OR and CI match exactly a table with 6 case carriers instead of 9. The error understates the enrichment by about one third in the Abstract, Results and Discussion, but it does not change the direction, the significance or the paper's conclusions.
What the paper reports
Abstract, Results:
A rare noncoding variant in an SCN5A intronic enhancer region was highly enriched in patients with BrS (detected in 3.9% of cases with a case-control odds ratio of 45.2).
Results, "Identification of Rare Noncoding Variants at SCN5A–SCN10A Locus", first paragraph (the denominators):
After sample-level quality control, a total of 231 unrelated probands and 500 ancestry-matched controls were included, with principal component analysis demonstrating the cohorts were of comparable ancestral background (Figure 1B).
Same section, fourth paragraph:
The RE5 variant was detected in 3.9% (n=9) of cases versus 0.2% (n=1) of controls (P=2.0E-04; OR, 20.2 [2.5–160.6]). We searched the Genomics Thailand database, comprising 10 043 individuals with a range of clinical and pharmacogenetics indications (https://genomicsthailand.com/Genomic/home), to attain a more precise estimate of the variant frequency in Thailand. It was detected in 6 individuals (0.06%), yielding an OR of 45.2 (14.5–141.3) compared with the BrS cohort (P=5.6E-12).
Methods, "Genetic Variant Analysis" (the test used):
Noncoding variants at the SCN5A–SCN10A locus were assessed for enrichment in cases versus controls using Fisher exact test (for samples with or without variants).
Discussion, first paragraph:
The variant is highly enriched in patients with BrS, with an OR between 20 and 45 based on our study controls and the Genomics Thailand database, respectively, and is located within a characterized enhancer region for SCN5A (RE5).
What the paper's own numbers show
Method. Following the Methods, each comparison is a 2×2 table of carriers and non-carriers. I computed the crude odds ratio a·d/(b·c) with a 95% Wald (Woolf) interval, exp(ln OR ± 1.96·√(1/a + 1/b + 1/c + 1/d)), and the two-sided Fisher exact P value; for completeness, also the conditional maximum-likelihood OR with its exact CI. I first checked the method on the paper's study-control comparison, then applied it to the Genomics Thailand comparison. I then tried the other plausible ways to compute the number (allele counts, a ratio of proportions, pooling the two control sources) and searched all integer tables near the stated counts for ones that reproduce the printed OR and both CI limits. Every number below is printed by recompute.py.txt.
| Quantity | Location | Reported | Recomputed from the paper's numbers |
|---|---|---|---|
| RE5 carriers, BrS cases | Results ¶4; Abstract | 3.9% (n=9) of 231 | 9/231 = 3.90% |
| RE5 carriers, study controls | Results ¶4 | 0.2% (n=1) of 500 | 1/500 = 0.20% |
| RE5 carriers, Genomics Thailand | Results ¶4 | 6 of 10 043 (0.06%) | 0.060% |
| OR, BrS vs study controls (method check) | Results ¶4; Discussion ¶1 | 20.2 (2.5–160.6), P = 2.0E-04 | Wald 20.2 (2.5–160.6); Fisher P = 2.04E-04 (matches) |
| OR, BrS vs Genomics Thailand | Results ¶4; Abstract; Discussion ¶1 | 45.2 (14.5–141.3) | Wald 67.8 (23.9–192.2); conditional MLE 67.6, exact CI 21.3–233.0 |
| Fisher P, BrS vs Genomics Thailand | Results ¶4 | 5.6E-12 | 5.6E-12 (matches) |
| Allele-based OR (all carriers heterozygous) | check | 45.2 | 66.5 (23.6–187.6) |
| Ratio of proportions (9/231)/(6/10 043) | check | 45.2 | 65.2 |
| Genomics Thailand and study controls pooled (7 of 10 543) | check | 45.2 | 61.0 (22.5–165.3) |
| Table with 6 case carriers, 6/222 vs 6/10 037 | check | 45.2 (14.5–141.3), P = 5.6E-12 | Wald 45.2 (14.5–141.3); Fisher P = 9.3E-08 |
| SE(ln OR) implied by the printed CI | derived | 14.5–141.3 | 0.581 (stated counts give 0.531; 6/222 vs 6/10 037 gives 0.581) |
| Genomics Thailand carriers that would give 45.2 with 9/222 cases | derived | 6 | 9; but 9/222 vs 9/10 034 gives CI 17.8–115.0, not 14.5–141.3 |
| Genomics Thailand size that would give 45.2 with 9 vs 6 carriers | derived | 10 043 | about 6 696 |
| Ultrarare SCN5A coding variants, 13/231 vs 5/500 (counts implied by the percentages) | Results ¶1 | 5.6% vs 1.0%, P = 4.0E-04 | Fisher P = 4.06E-04 (consistent) |
| p.Arg965Cys, 15/231 vs 2/500 | Results ¶1 | 6.5% vs 0.4%, P = 1.6E-06 | Fisher P = 1.59E-06 (consistent) |
| Other low-frequency coding variants, 9/231 vs 15/500 | Results ¶1 | 3.9% vs 3.0%, P = 0.51 | Fisher P = 0.511 (consistent) |
| RE5 carriers with cardiac arrest | Abstract; Results | 89% (8/9) | 88.9% (consistent) |
The search over integer tables (1–20 case carriers, 200–240 case non-carriers, 1–20 population carriers, population totals of 10 043 or 10 543) found two tables whose Wald OR and both limits round to 45.2, 14.5 and 141.3. One is 6/222 vs 6/10 037: the stated table with the case-carrier cell set to 6, the Genomics Thailand carrier count. The other, 6/233 vs 6/10 537, needs 239 cases and does not match the 7 carriers in the pooled controls, so it does not correspond to any group in the paper. Setting the population carrier count to 9 instead (9/222 vs 9/10 034) gives OR 45.2, but its CI is 17.8–115.0, so it does not reproduce the printed interval. Neither do the allele-based, proportion-ratio or pooled calculations.
The printed P value, by contrast, matches only the stated table. The 6-carrier table would give P = 9.3E-08, about 16 500 times larger than the printed 5.6E-12.
Figure
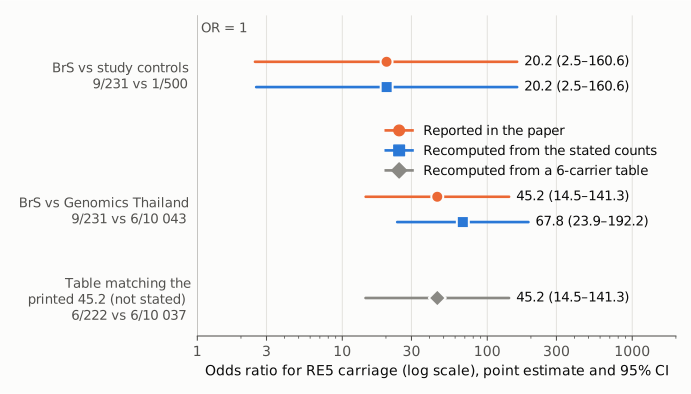
Figure 1. Odds ratios for RE5 carriage, with 95% confidence intervals, on a logarithmic axis; the thin vertical line marks OR = 1. Orange circles are the values printed in the paper; blue squares are Wald odds ratios recomputed from the counts the paper states. For the study-control comparison (9/231 vs 1/500), the two coincide, which confirms the method. For the Genomics Thailand comparison (9/231 vs 6/10 043), the printed 45.2 (14.5–141.3) lies below the recomputed 67.8 (23.9–192.2). The gray diamond is a table that is not stated anywhere in the paper, 6 case carriers instead of 9 (6/222 vs 6/10 037). It reproduces the printed OR and both CI limits exactly.
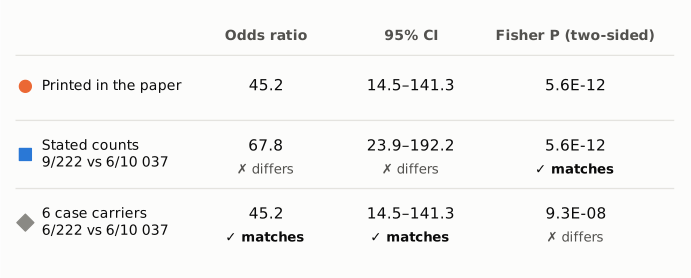
Figure 2. The three numbers printed for the Genomics Thailand comparison (orange row), set against the values from the stated table (blue row) and from the 6-carrier table (gray row). "Matches" and "differs" compare each value with the printed value in the same column. The stated counts reproduce the printed P value but not the OR or CI; the 6-carrier table reproduces the OR and CI but not the P value. The printed P value and the printed OR therefore come from different tables.
Why it matters
The odds ratio of 45.2 is the only effect size in the Abstract's Results, where it is presented as the variant's "case-control odds ratio". The Discussion repeats it as the upper end of "an OR between 20 and 45". It is the figure a reader would quote for the size of the RE5 enrichment. From the counts the paper states, the odds ratio against the Thai population database is about 68 (95% CI 24–192), and the ratio of carrier proportions is about 65. The printed value understates the enrichment by about one third. Its CI is also shifted down: the printed lower limit of 14.5 is well below the recomputed 23.9.
The error is conservative, and it does not change any conclusion. With the stated counts the enrichment is larger, the printed P value already reflects them, and the comparison stays highly significant. The other headline numbers do not depend on this odds ratio and are unaffected: the 3.9% case frequency, the study-control OR of 20.2, the estimate of about 43 000 carriers in Thailand (based on the 0.06% database frequency), the hiPSC-CM functional results and the pathogenicity argument. A smaller point: the Abstract calls 45.2 a "case-control" odds ratio, but the Results compute it against a population database "with a range of clinical and pharmacogenetics indications", not against the study's ancestry-matched controls. The case-control figure in the narrower sense is 20.2.
Explanations considered
- A different OR method (exact or conditional MLE instead of Wald). This does not account for the numbers. The conditional MLE for the stated table is 67.6 (exact CI 21.3–233.0), essentially the same as the Wald 67.8. The Wald method reproduces the paper's study-control OR, 20.2 (2.5–160.6), to every printed digit.
- Allele counts instead of carrier counts. This does not account for the numbers. All RE5 carriers are heterozygous (the supplementary Table S8 lists Hom = 0 for Genomics Thailand), and an allele-based OR is 66.5 (23.6–187.6). The Methods also say the test compared "samples with or without variants".
- A ratio of proportions rather than an odds ratio. This does not account for the numbers. (9/231)/(6/10 043) = 65.2.
- Pooling Genomics Thailand with the study controls. This does not account for the numbers. With 7 carriers among 10 543 people, the OR is 61.0 (22.5–165.3). Table S8 lists the pooled "Thai all controls" as AC = 7.
- A subset of cases or a different database size. No subset is described. No supplementary table gives a case subset or denominator that would produce 45.2. A database of about 6 696 people would be needed with 9 vs 6 carriers, but the Methods, Results and Table S8 (AN = 20 086 alleles) all give 10 043.
- A typographical error in the OR. A single mistyped digit cannot explain it, because the OR and both CI limits agree with each other: the log-midpoint of 14.5–141.3 is 45.3, and the interval's width implies SE(ln OR) = 0.581, which matches the 6/222 vs 6/10 037 table and not the stated one (0.531). The three numbers fit a single table with 6 case carriers. This is consistent with the case-carrier cell having been entered as 6, the database carrier count. The paper does not say how the value was computed, so this cannot be confirmed from published material.
- A conversion or typesetting error in the archived text. This is excluded. The PMC text, the publisher-supplied JATS XML in Europe PMC and the medRxiv preprint (doi:10.1101/2023.12.19.23299785) all carry 45.2 (14.5–141.3) with P = 5.6E-12.
Status
- Version of record. The publisher's site (ahajournals.org, reached from doi.org) returned HTTP 403 to automated requests, and so did the Europe PMC PDF route. The wording above was confirmed in the PMC article page, the Europe PMC full-text XML (publisher JATS) and the local PMC archive, which carry identical numbers. Every quotation in this write-up was checked verbatim against the PMC-archived text with
src/show.py. The medRxiv preprint carries the same 45.2 (14.5–141.3) and P = 5.6E-12, so the value predates production. - Supplements. The PMC supplementary bundle has three files: cir-151-31-s002.pdf (Supplemental Methods and the captions of Tables S1–S8), cir-151-31-s003.xlsx (Tables S1–S8) and cir-151-31-s004.docx (genotyping primers). Table S8 lists Genomics Thailand RE5 as AC = 6, AN = 20 086, Hom = 0, the Thai study controls as AC = 1/AN = 1 000 and "Thai all controls" as AC = 7/AN = 21 086. Table S5 lists the 9 RE5-carrying probands. No supplementary table resolves the discrepancy.
- Corrections and comments. As of 2026-10-24 I found no correction, erratum, expression of concern or retraction. Crossref lists no update relations for the DOI, and PMC and Europe PMC list no correction notices. A web search for corrections or comments on the article found none. PubPeer could not be checked directly: its search page returned HTTP 403 and its API returned 404 for this DOI.
- Sources. PMC article PMC11670919; Europe PMC full-text XML and supplementary files for PMC11670919; medRxiv preprint 10.1101/2023.12.19.23299785; Crossref; Europe PMC.
Suggested correction
- In the Results, replace "yielding an OR of 45.2 (14.5–141.3) compared with the BrS cohort (P=5.6E-12)" with the value from the stated counts (9/231 cases vs 6/10 043 Genomics Thailand individuals): OR 67.8 (95% CI 23.9–192.2), P = 5.6E-12. If the authors prefer the conditional MLE with an exact interval, that is 67.6 (21.3–233.0).
- Correct the Abstract ("a case-control odds ratio of 45.2") to match. Since 45.2 compares cases with a population database rather than with the study's matched controls, the Abstract could also give the study-control OR of 20.2, or describe the 68 as an OR against the Thai population database.
- In the Discussion, change "an OR between 20 and 45" to "an OR between 20 and 68" (or the equivalent wording).
- If the corrected value appears in any figure or graphical abstract not checked here (for example Figure 1A, which shows ORs for each haplotype, or Figure 4), update it there too.