← Back to the plain-language case
Abstract reports PGS-ADHD odds ratios above 1 as decreased odds; Results report them below 1
Psychol Med (2024) · doi:10.1017/S0033291724002186 · PMC11578915
Summary
The study fits multinomial regressions of four treatment trajectories on polygenic scores (PGS) in 10,577 people with early-onset depression, with the brief contact trajectory as the reference. The Abstract says higher PGS-ADHD was linked to "decreased odds" of the prolonged initial contact and persistent contact trajectories, but it prints odds ratios above 1 for both: 1.06 (1.01–1.11) and 1.12 (1.03–1.21). For the same comparisons the Results text and Supplementary Table 2 give 0.91 (0.87–0.96), p = 0.0002, and 0.90 (0.83–0.97), p = 0.007. All four intervals exclude 1, so the Abstract's numbers disagree with the body in direction and value, and the two Abstract triples are identical to the PGS-AN rows of Supplementary Table 2. The Abstract is the paper's most widely read summary, and its printed figures reverse the direction of the result the Discussion calls the strongest.
What the paper reports
Relative to the brief contact trajectory, higher PGS for ADHD was associated with a decreased odds of membership in the prolonged initial contact (odds ratio = 1.06, 95% confidence interval = 1.01–1.11) and persistent contact (1.12, 1.03–1.21) trajectories, while PGS-AN was associated with increased odds of membership in the persistent contact trajectory (1.12, 1.03–1.21).
— Abstract, Results
PGS-ADHD was associated with decreased odds of membership in the prolonged initial contact (OR = 0.91 [0.87–0.96], p = 0.0002) and persistent contact classes (OR = 0.90 [0.83–0.97], p = 0.007). PGS-AN was associated with increased odds of membership in the persistent contact class (OR = 1.12 [1.03–1.21], p = 0.005).
— Results, "PGS and trajectory patterns in secondary care", second paragraph
For each PGS and family history variable, we calculated the odds ratio (OR), 95% confidence intervals (CIs), and p-value for trajectory class membership relative to the brief contact class using multinomial regression models adjusted for sex, age-at-onset, and calendar year-at-diagnosis in three-year bands.
— Methods, "Statistical analysis"
Statistical significance was assessed at the Bonferroni-adjusted alpha of 0.0083 for the PGS (0.05/6 PGSs), and 0.017 for parental history (0.05/3 parental history variables).
— Methods, "Statistical analysis"
The brief contact class (class 1) was used as the reference category in the multinomial regressions.
— Figure 2 legend
The strongest results were for PGS-ADHD, which was associated with increased likelihood of a brief contact pattern relative to the prolonged initial contact and persistent contact patterns, particularly for younger individuals.
— Discussion
Supplementary Table 2 ("Associations between continuous polygenic scores (PGSs) and trajectory classes"; brief contact is the reference) lists, as OR, SE, p-value, lower CI, upper CI:
Prolonged initial contact | PGS-ADHD | 0.91 | 0.02 | 2.12x10-04 | 0.87 | 0.96 Persistent contact | PGS-ADHD | 0.90 | 0.04 | 6.99x10-03 | 0.83 | 0.97 Prolonged initial contact | PGS-AN | 1.06 | 0.02 | 3.06x10-02 | 1.01 | 1.11 Persistent contact | PGS-AN | 1.12 | 0.04 | 5.00x10-03 | 1.03 | 1.21
— Supplementary material (S0033291724002186sup001.docx), STable 2, rows for PGS-ADHD and PGS-AN
What the paper's own numbers show
Method. In a multinomial logistic model with brief contact as the reference, the odds ratio for class k is exp(β), where β is the change in log[P(k)/P(brief)] per SD of PGS. An OR above 1 therefore means increased odds of class k relative to brief contact, and an OR below 1 means decreased odds. A Wald 95% CI is exp(β ± 1.96 SE), so SE = (ln hi − ln lo)/3.92, z = ln(OR)/SE and the two-sided p follows. I applied this to every Abstract and Results triple. I also took reciprocals of the Results values, to test whether a swapped reference category could produce the Abstract's numbers, and searched all 18 rows of Supplementary Table 2, and the other trajectory-class tables of the supplement (STables 3, 4, 5 and 18), for the Abstract's exact OR and CI bounds and for any PGS-ADHD estimate above 1 for these two classes. Every number below is printed by recompute.py.txt (Python, numpy/scipy).
| Quantity | Location | Reported | Recomputed from the paper's numbers |
|---|---|---|---|
| PGS-ADHD, prolonged initial contact | Abstract | 1.06 (1.01–1.11), "decreased odds" | OR > 1, so increased odds (+6% per SD); z = +2.42, p = 0.0155 |
| PGS-ADHD, prolonged initial contact | Results text; STable 2 | 0.91 [0.87–0.96], p = 0.0002 | OR < 1, decreased odds (−9% per SD); z = −3.76, p = 0.0002 |
| PGS-ADHD, persistent contact | Abstract | 1.12 (1.03–1.21), "decreased odds" | OR > 1, so increased odds (+12% per SD); z = +2.76, p = 0.0058 |
| PGS-ADHD, persistent contact | Results text; STable 2 | 0.90 [0.83–0.97], p = 0.007 | OR < 1, decreased odds (−10% per SD); z = −2.65, p = 0.0081 |
| PGS-AN, persistent contact | Abstract; Results text; STable 2 | 1.12 [1.03–1.21] (p = 0.005 in Results text and STable 2) | z = +2.76, p = 0.0058; all three places agree |
| Reciprocal of Results PGS-ADHD, prolonged | derived | Abstract: 1.06 (1.01–1.11) | 1.10 [1.04–1.15]; does not match |
| Reciprocal of Results PGS-ADHD, persistent | derived | Abstract: 1.12 (1.03–1.21) | 1.11 [1.03–1.20]; does not match |
| Supplement rows equal to the Abstract's "ADHD, prolonged" triple | STable 2; STable 5 | 1.06 (1.01–1.11) | PGS-AN, prolonged initial contact, in STable 2 (printed p = 0.0306) and in STable 5 (printed p = 0.0281); no PGS-ADHD row |
| STable 2 rows equal to the Abstract's "ADHD, persistent" triple | STable 2 | 1.12 (1.03–1.21) | one row: PGS-AN, persistent contact |
| Abstract prolonged-contact value against the Bonferroni α | Abstract; Methods | α = 0.05/6 = 0.0083 | p = 0.0155 from the CI (0.0306 as printed in STable 2 for the matching PGS-AN row); neither passes |
| PGS-ADHD in the mutually adjusted model | STable 5 | 0.90 [0.86–0.95] and 0.91 [0.84–0.99] | both below 1 |
| PGS-ADHD for these two classes in the age strata and top-decile/5% contrasts | STable 18; STables 3–4 | 18 estimates | 16 below 1; 2 point estimates above 1 (age 21–25, persistent contact, 1.13 [0.98–1.31], p = 0.0968; top 5% vs bottom 5%, persistent contact, 1.04 [0.62–1.74]), both with CIs that include 1; none has a CI wholly above 1 and none matches an Abstract triple |
The Results-text and STable 2 values are internally consistent: the p values recovered from their CIs (0.0002 and 0.0081) match the printed 0.0002 and 0.007 to within rounding of the two-decimal bounds. The Abstract's two "ADHD" triples are not consistent with the word "decreased" in the same sentence, with the Results text, or with any reciprocal of it. Each matches, digit for digit, a PGS-AN row of Supplementary Table 2.
Figure
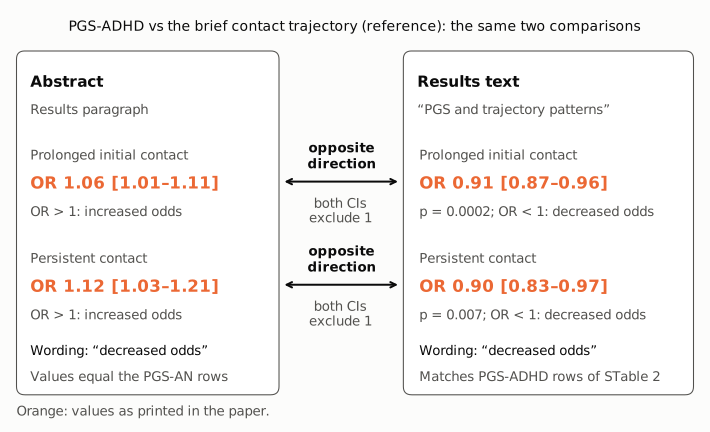
Figure 1. The two PGS-ADHD comparisons against the brief contact trajectory, as printed in the Abstract (left) and in the Results text (right). All numbers are copied from the paper (orange: Abstract and Results text as printed); no recomputed values are drawn. The Abstract prints OR 1.06 (1.01–1.11) for prolonged initial contact and 1.12 (1.03–1.21) for persistent contact, both above 1. The Results text, which agrees with Supplementary Table 2, prints 0.91 [0.87–0.96] (p = 0.0002) and 0.90 [0.83–0.97] (p = 0.007), both below 1. Each pair of intervals excludes 1 on opposite sides, so the two sources disagree in direction, not only in value. Both sources describe the association in words as "decreased odds", which fits only the Results values. The Abstract's two triples are identical to the PGS-AN rows of Supplementary Table 2 for the same classes.
Why it matters
The PGS-ADHD association is the result the Discussion singles out as "the strongest". The Abstract is what most readers, indexers and citing authors see, and it is the only part of the paper whose numbers point the other way. A reader who takes the Abstract's numbers at face value would conclude that higher PGS-ADHD raises the odds of the longer-treatment trajectories, by about 6% and 12% per SD. The body says the opposite: it lowers them, by about 9% and 10% per SD. The Abstract's prolonged-contact value would also fail the paper's own multiple-testing threshold (p = 0.0155 from its CI, against α = 0.0083), whereas the body's value passes (p = 0.0002). Anyone pooling these estimates in a meta-analysis or citing them from the Abstract would carry the wrong sign.
The error is confined to the Abstract's numbers. The Abstract's wording, the Results text, Figure 2 (brief contact as reference), Supplementary Tables 2 and 5, the Discussion and the Conclusions all agree with ORs below 1, and the age-stratified results describe "the negative association between PGS-ADHD and the persistent contact class" as driven by ages 10–20 (STable 18: 0.81 [0.71–0.94] at 10–15 and 0.84 [0.74–0.95] at 16–20). The paper's main conclusions are therefore not affected.
Explanations considered
- A different reference category. The Abstract states the comparison as "relative to the brief contact trajectory", the same as the Methods, the Results text and the Figure 2 legend. If the reference were swapped, the Results values would become 1.10 [1.04–1.15] and 1.11 [1.03–1.20]. Neither matches the Abstract's 1.06 (1.01–1.11), and a swap would also make the Abstract's word "decreased" wrong. This does not account for the numbers.
- A different model or subgroup. The mutually adjusted model (STable 5) gives PGS-ADHD ORs of 0.90 [0.86–0.95] and 0.91 [0.84–0.99]. The age-stratified analyses are described as a "negative association". No model or subgroup in the paper gives a PGS-ADHD OR for these two classes whose CI lies entirely above 1, or that matches the Abstract's triples. The only point estimates above 1 (age 21–25, persistent contact, 1.13 [0.98–1.31], STable 18; top 5% vs bottom 5%, persistent contact, 1.04 [0.62–1.74], STable 4) have CIs that include 1. This does not account for the numbers.
- A text-conversion or rendering artifact. The same values appear in the PMC archive, the Europe PMC full text, the publisher's abstract deposited with Crossref, and the Cambridge Core version of record. They are complete OR–CI triples in running text, with no minus signs, superscripts or table cells involved. This does not account for the numbers.
- The Abstract being correct and the body wrong. The Results text, Supplementary Table 2 (with p values that match its CIs), Supplementary Table 5, the Discussion, and the Abstract's own wording all agree on ORs below 1. Only the Abstract's two numeric triples disagree. The body values are the ones supported throughout the paper.
- Values carried from another row. Both Abstract triples equal, OR and both CI bounds, the PGS-AN rows of Supplementary Table 2 for the same two classes (1.06 [1.01–1.11], p = 0.0306; 1.12 [1.03–1.21], p = 0.005). The same 1.06 (1.01–1.11) triple is also the PGS-AN, prolonged initial contact row of the mutually adjusted model (STable 5, p = 0.0281), and it appears nowhere in the main text. This match is consistent with the Abstract reporting the PGS-AN rows under the PGS-ADHD label. It describes what the numbers show, not how they came to be there.
No explanation found reconciles the Abstract's numbers with the rest of the paper.
Status
- Version of record. Checked on Cambridge Core (doi.org resolves to cambridge.org/core/product/identifier/S0033291724002186/type/journal_article). The Abstract and Results text carry the same values as the PMC archive. The publisher's abstract in the Crossref record and the Europe PMC full text also carry 1.06 (1.01–1.11) and 1.12 (1.03–1.21).
- Supplement. S0033291724002186sup001.docx, downloaded through Europe PMC. STable 2 and STable 5 support the Results text, as shown above; STables 3, 4 and 18 contain no PGS-ADHD estimate for these two classes that matches the Abstract or has a CI wholly above 1. A side observation: the STable 2 and STable 5 footnotes give the Bonferroni alpha as "0.00083", while the Methods give 0.0083 (0.05/6). This does not bear on the Abstract discrepancy.
- Corrections. As of 2026-10-23 no correction, erratum, corrigendum, expression of concern or retraction was found. Crossref lists no update relations for the DOI, and a Crossref
updatesfilter search returned none. PMC and Europe PMC list no notices. - PubPeer. The PubPeer API and search page refused automated access (Cloudflare challenge). A web search for the title with "pubpeer" returned no PubPeer thread.
- Sources. PMC11578915 (local archive via
src/show.py); Europe PMC full text and supplementary files; Crossref works record for 10.1017/S0033291724002186; Cambridge Core version of record; PubPeer;src/known.py.
Suggested correction
In the Abstract, Results paragraph, replace "(odds ratio = 1.06, 95% confidence interval = 1.01–1.11)" with "(odds ratio = 0.91, 95% confidence interval = 0.87–0.96)" and "persistent contact (1.12, 1.03–1.21) trajectories" with "persistent contact (0.90, 0.83–0.97) trajectories", matching the Results text and Supplementary Table 2. The PGS-AN estimate in the same sentence (1.12, 1.03–1.21) is correct and needs no change. Separately, the Bonferroni alpha in the footnotes of Supplementary Tables 2 and 5 could be corrected from 0.00083 to 0.0083 to match the Methods.