← Back to the plain-language case
Abstract gives each arm's effect-size ranges to the other: incentives versus information
Lancet Reg Health Eur (2024) · doi:10.1016/j.lanepe.2024.101102 · PMC11513846
Summary
The Findings section of the abstract attributes annual trend improvements of 6.66 to 1.25 percentage points and step changes up to 8.87 points to the incentivized indicators. It attributes step changes of 19.67 to 1.07 points and trend improvements of 1.09 to 0.34 points per year to information provision. In the paper's own Table 1, and in the Results text, the assignment is the reverse. Every one of the first set of numbers comes from rows labelled "Introduced as Informed", and every one of the second set from rows labelled "Introduced as Incentivized". The abstract's shares of indicators with a positive impact (9/12 informed, 7/11 incentivized) reproduce from the tables. But the abstract's description of what each strategy achieved is reversed: incentives produced the largest immediate step changes, and information produced the largest sustained trend changes.
What the paper reports
Abstract, Findings:
Informed indicators showed positive impacts in 75% (9/12) of cases, and incentivized indicators in 64% (7/11) of cases. Incentivized indicators displayed improvements in annual trends ranging from 6.66 to 1.25 percentage points, with step changes up to 8.87 percentage points. Information led to step changes ranging from 19.67 to 1.07 percentage points, along with trend improvements between 1.09 and 0.34 percentage points annually.
Abstract, Interpretation:
Our findings reveal that information provision alone can match or even surpass the impact of financial incentives in improving care quality and reducing practice variability.
Results, section "The impact of incentivization on newly introduced indicators":
Incentivization positively impacted indicator results or variability in seven of 11 new indicators (64%; 5/6 quaternary prevention and 2/3 control indicators; Fig. 2, Supplementary Figures S4–S6). Four showed significant step increases in results post-implementation (19.67 to 1.07 percentage point changes), while four demonstrated positive trend changes (1.09 to 0.34 percentage point improvements annually).
Results, section "The effect of information without incentivization on new indicators":
Specifically, six of 12 indicators displayed significantly positive changes in the post-intervention trends (6.66 to 1.25 percent point improvements per year), four of which showed additional step improvements in results after their introduction as informed (from 8.87 to 1.25 %-point increases; Fig. 2, Table 1, Supplementary Figure S4).
Table 1, rows that carry the end points of the ranges (columns: Indicator | Derived | Scheme change | Year | Baseline | Trend before | Step change | Change in trend | End result):
Reduction of alcohol consumption in high-risk drinkers | New | Introduced as Incentivized | 2014 | 21.67 | 1.39 (0.29–2.48)c | 19.67 (11.34–27.99)c | -0.7 (-3.14 to 1.74) | 46.58
Low cardiovascular risk with poorly indicated lipid-lowering agentsa | New | Introduced as Incentivized | 2014 | 7.55 | -0.25 (-0.33 to -0.18)c | -1.07 (-1.55 to -0.6)c | -0.34 (-0.48 to -0.2)c | 2.72
Adequacy of treatment for acute bronchitis, acute rhinopharyngitis, and influenza | New | Introduced as Incentivized | 2014 | 77.73 | -0.15 (-0.6 to 0.3) | 2.36 (0.74–3.98)c | 1.09 (0.52–1.65)c | 84.52
Diagnostic adequacy of cardiovascular disease | New | Introduced as Informed | 2013 | 13.53 | 6.08 (4.98–7.18)c | 8.87 (6.32–11.41)c | 6.66 (5.56–7.77)c | 52.88
Patients with excessive control of T2DMa | New | Introduced as Informed | 2017 | 41.42 | 1.08 (0.6–1.57)c | -2.15 (-4.65 to 0.36) | -1.25 (-1.74 to -0.77)c | 46.2
Table 1, footnote:
Inverse indicators (negative step and trend changes represent improvement).
Methods, Statistical analysis:
Significant improvements in either metric were classified as “positive impact”.
What the paper's own numbers show
Method. I transcribed the step change and change in trend, with their 95% CIs, for all 30 new-indicator rows of Table 1. These are the 11 rows "Introduced as Incentivized", the 12 "Introduced as Informed" and the 7 "Informed to Incentivized". An effect was counted as significant when its 95% CI excludes zero. This reproduces the table's significance marks in all 60 cells. An effect was counted as favourable when it is positive, or negative for an inverse indicator (Table 1 footnote a). It was then expressed as a magnitude. For each group I listed the favourable significant step and trend changes and took their range. Then I checked which group each number in the abstract comes from. To check the abstract's shares (9/12, 7/11), I applied the paper's definition of "positive impact" to Table 1 and to Table 2 (coefficient of variation, where a reduction is favourable). Every number below is printed by recompute.py.txt.
| Quantity | Location | Reported | Recomputed from the paper's own numbers |
|---|---|---|---|
| Trend improvements, 6.66 to 1.25 pp/yr | Abstract: "Incentivized indicators" | assigned to incentivized | Introduced as Informed rows: 6.66, 5.70, 5.53, 3.18, 1.95, 1.25 (n = 6). No incentivized row has a favourable trend change above 1.09 |
| Step changes up to 8.87 pp | Abstract: "Incentivized indicators" | assigned to incentivized | Introduced as Informed row (cardiovascular disease diagnosis, 8.87). Largest incentivized step is 19.67 |
| Step changes, 19.67 to 1.07 pp | Abstract: "Information" | assigned to information | Introduced as Incentivized rows: 19.67, 19.66, 2.36, 1.48, 1.07 (n = 5; 1.48 and 1.07 are inverse indicators). Largest informed step is 8.87 |
| Trend improvements, 1.09 to 0.34 pp/yr | Abstract: "Information" | assigned to information | Introduced as Incentivized rows: 1.09, 1.09, 0.89, 0.34 (n = 4). Smallest informed trend is 1.25 |
| Incentivized step changes | Results, incentivization section | "Four", 19.67 to 1.07 | range agrees (19.67 to 1.07); count is 5 (3 positive steps plus 2 favourable negative steps of inverse indicators) |
| Incentivized trend changes | Results, incentivization section | "four", 1.09 to 0.34 | agrees: n = 4, 1.09 to 0.34 |
| Informed trend changes | Results, information section | "six", 6.66 to 1.25 | agrees: n = 6, 6.66 to 1.25 |
| Informed step changes | Results, information section | "four", "from 8.87 to 1.25" | count agrees (n = 4); range is 8.87 to 3.41. 1.25 is the smallest favourable trend, not a step |
| "Informed to Incentivized" rows (2015) | Table 1 | — | no favourable significant step or trend changes; the 5 significant trend changes are all negative (−8.93, −3.24, −2.81, −5.36, −0.67) |
| Share with positive impact, informed | Abstract | 75% (9/12) | 9/12 (6 on results, 8 on CV, 9 on either) |
| Share with positive impact, incentivized | Abstract | 64% (7/11) | 7/11 (6 on results, 5 on CV, 7 on either) |
| Largest step, incentivized vs informed | Table 1 | — | 19.67 vs 8.87 pp (ratio 2.22) |
| Largest trend change, informed vs incentivized | Table 1 | — | 6.66 vs 1.09 pp/yr (ratio 6.11) |
All four end points of the abstract's "incentivized" figures (6.66, 1.25 and 8.87) occur only among informed rows. All four end points of its "information" figures (19.67, 1.07, 1.09, 0.34) occur only among incentivized rows. The Results text and Table 1 agree on the assignment. The abstract's first sentence (the shares) also agrees with the tables. Only the two sentences giving effect sizes carry the labels the other way round.
Figure
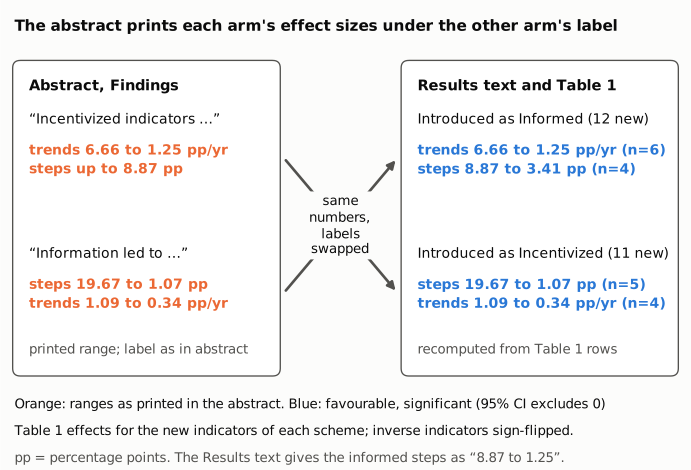
Figure 1. Left: the effect-size ranges as printed in the abstract's Findings section, under the label the abstract gives them (orange). Right: the ranges recomputed from the favourable, significant Table 1 step and trend changes of the new indicators in each scheme-change group (blue), with inverse indicators sign-flipped as the Table 1 footnote directs. The crossing connectors show that each printed set matches the opposite group. The one difference in the informed step range (8.87 to 3.41 recomputed vs "8.87 to 1.25" in the Results text) is a separate small slip in the Results, noted in the footnote line. pp = percentage points.
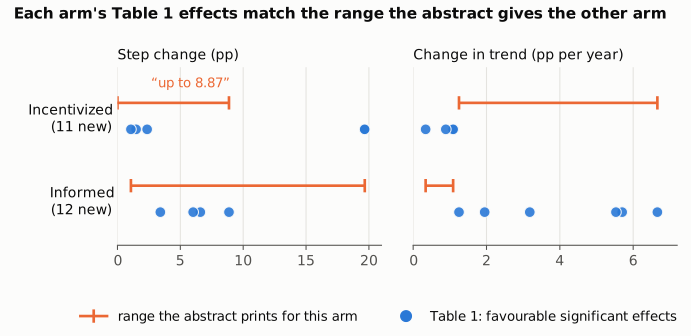
Figure 2. Each blue dot is one favourable, significant effect from Table 1 for a new indicator in that arm (left: step changes, pp; right: changes in trend, pp per year). Each orange bar is the range the abstract prints for that arm. For "Incentivized" that range is "up to 8.87" for steps, drawn from 0, and 6.66 to 1.25 for trends; for "Information" it is 19.67 to 1.07 and 1.09 to 0.34. The two incentivized steps near 19.7 (alcohol, 19.67; hyperuricemia, 19.66) lie outside the abstract's incentivized step range, and all four incentivized trend changes lie below its incentivized trend range. The informed trend changes lie above the abstract's informed trend range. Axes start at zero.
Why it matters
- The abstract inverts each strategy's effect profile. As printed, information looks as if it produced the large immediate jumps (up to 19.67 points) but only small sustained gains (at most 1.09 points per year), and incentives the reverse. Table 1 shows the opposite. Incentives produced the two largest step changes (19.67 and 19.66 points), and information produced trend improvements up to 6.66 points per year, about six times the largest incentivized trend change (1.09). For a paper whose purpose is to compare the two strategies, this comparison is a key result.
- It bears on the evidence offered for the Interpretation. The abstract concludes that information "can match or even surpass" incentives. As printed, its largest step-change figure appears under information, which reads as direct support for "surpass". On the corrected assignment the conclusion can still be argued, from the larger sustained trend gains under information and from the shares of indicators improved (75% vs 64%). But the step-change evidence points the other way.
- The main analysis is not affected. The Results text and Table 1 assign the numbers correctly, and the shares of indicators with positive impact (9/12, 7/11) reproduce from Tables 1 and 2. The variability, derived-indicator and robustness results, and the finding that later incentivization of informed indicators added no gains, do not depend on the two swapped sentences. The title, the Research in context panel and the Discussion give only the shares, not the effect-size ranges. No estimate, direction or significance changes. The error is confined to the abstract, but the abstract is the part most readers and indexing services see.
Explanations considered
- Inverse indicators. These do not account for it, but they explain why two of the printed end points are written without a sign. The Table 1 footnote says negative changes are improvements for inverse indicators. The incentivized step −1.07 and trend −0.34 (low-risk patients on poorly indicated lipid-lowering agents), and the informed trend −1.25 (excessive control of T2DM), are favourable effects of size 1.07, 0.34 and 1.25. Taking magnitudes makes the incentivized and informed ranges match the Results text exactly. It does not move any number between groups.
- "Incentivized" in the abstract meaning the seven indicators informed in 2013 and incentivized in 2015. Ruled out. In Table 1 none of these rows has a significant step change, and all five significant trend changes are negative. The Results text says the same: incentivizing previously informed indicators "did not result in significant step changes in results or variability, nor in favorable changes in post-intervention trends". The abstract's "incentivized" figures (6.66, 1.25, 8.87) can only come from the "Introduced as Informed" rows.
- Derived indicators or a different subset. Ruled out. The abstract's next sentence treats derived indicators separately ("minor step increases up to 2.22 percentage points"). None of 19.67, 1.07, 1.09, 0.34, 6.66 or 8.87 appears among the derived rows of Table 1. The supplement does not contain 19.67, 8.87, 6.66, 1.07 or 1.25 anywhere.
- A different metric (variability rather than results). Ruled out. Table 2 values are coefficient-of-variation changes on a scale of hundredths (for example −0.18 to −0.001). The abstract's ranges are percentage points and match Table 1 exactly.
- A text-conversion artifact. Ruled out. The abstract's wording is the same in the live PMC page and in the Europe PMC full-text XML deposited by the publisher. The swap lies in which words go with which numbers, which a conversion step would not change.
- A correction already issued. None found (see Status).
- Side observations, not part of the main finding. (1) The incentivization section says "Four showed significant step increases" with the range 19.67 to 1.07. Table 1 has five favourable significant steps in that group (19.67, 19.66, 2.36, and the inverse-indicator steps −1.48 and −1.07). The range includes one inverse-indicator step but the count leaves out the other. (2) The information section gives the informed step improvements as "from 8.87 to 1.25". The smallest of the four informed steps is 3.41 (respiratory disease diagnosis). 1.25 is the smallest favourable informed trend change, which ends the previous range in the same sentence. (3) The incentivized row "Weight reduction in obese and overweight patients" has a significant unfavourable step (−2.86) together with a favourable trend change (0.89), and is counted among the positive impacts by the paper's either-metric rule. That follows the stated definition and is not an error.
Status
- Version of record. The publisher pages (doi.org resolves to linkinghub.elsevier.com, pii S2666776224002692; thelancet.com; sciencedirect.com) returned only a redirect stub or HTTP 403 to automated requests. The text was therefore checked in two copies of the publisher-deposited full text: the live PMC page (pmc.ncbi.nlm.nih.gov/articles/PMC11513846/) and the Europe PMC full-text XML. Both carry the abstract and Results passages quoted above and the same Table 1 values. Every quotation was checked verbatim against the PMC-archived text with
src/show.py. - Supplements. The single supplementary file,
mmc1.pdf("Supplementary Figures and Tables", 27 pages, from the Europe PMC supplementary bundle), holds indicator descriptions, a contingency table, ITS analyses of the 24 robustness-check indicators (results and CV), logit sensitivity analyses and supplementary figures. None of 6.66, 8.87, 19.67, 1.07 or 1.25 occurs in its text, and it contains no summary statement assigning the ranges to either arm. It neither resolves nor alters the finding. The group of each row is fixed by the "Scheme change" column of main-text Table 1. - Corrections and comments. As of 2026-10-24 I found no correction, erratum, retraction or expression of concern.
src/known.pyreturns no Crossref update relations, no PMC notices and no Europe PMC notices. A web search for the title with "correction", "erratum" or "PubPeer" found no notice or thread. The PubPeer API returned no record (HTTP 404) for the DOI, and a web search for the DOI with "PubPeer" found no thread. - Sources. PMC article PMC11513846; Europe PMC full-text XML and supplementary files for PMC11513846 (
mmc1.pdf); Crossref; Europe PMC; PubPeer; https://doi.org/10.1016/j.lanepe.2024.101102.
Suggested correction
In the abstract, Findings, replace
Incentivized indicators displayed improvements in annual trends ranging from 6.66 to 1.25 percentage points, with step changes up to 8.87 percentage points. Information led to step changes ranging from 19.67 to 1.07 percentage points, along with trend improvements between 1.09 and 0.34 percentage points annually.
with
Information led to improvements in annual trends ranging from 6.66 to 1.25 percentage points, with step changes up to 8.87 percentage points. Incentivized indicators displayed step changes ranging from 19.67 to 1.07 percentage points, along with trend improvements between 1.09 and 0.34 percentage points annually.
The authors may also wish to check two smaller points in the Results against Table 1. In the information section, the informed step improvements run from 8.87 to 3.41, not "to 1.25". In the incentivization section, five, not four, favourable significant step changes lie in the stated 19.67 to 1.07 range, if the inverse-indicator steps (−1.48 and −1.07) are counted as the range implies.