← Back to the plain-language case
Abstract gives P < .001 for MS and primary MR; Table 3 gives .049 and .034
Eur Heart J (2024) · doi:10.1093/eurheartj/ehae523 · PMC11452747
Summary
The abstract states that, on multivariable regression, concordance with recommended treatment was significantly poorer in women with mitral stenosis (MS) and primary mitral regurgitation (MR), "both P < .001". The Results text and Table 3 report this same analysis (intervention scheduled or performed among patients with a class I indication, adjusted for EuroSCORE II) as OR 0.38 (95% CI 0.15–1.00), P = .049 for MS and OR 0.60 (95% CI 0.38–0.96), P = .034 for primary MR. Wald P-values back-calculated from the printed ORs and CIs are about .046 and .031, which agree with Table 3 and not with the abstract. No other analysis in the paper gives P < .001 for either subgroup. The finding supports one of the abstract's three conclusions, and the abstract presents two borderline results, one with a CI that reaches 1.00, as highly significant.
What the paper reports
Abstract, Results:
On multivariable regression analysis, concordance with recommended treatment was significantly poorer in women with MS and primary MR (both P < .001).
Abstract, Conclusions (repeated as point (ii) of the main Conclusions section):
(ii) concordance with recommended intervention for MS and primary MR was significantly lower for women;
Results, "Clinical management strategies", third paragraph:
Regarding treatment in concordance with class I indications of the 2012 ESC/EACTS guidelines and the 2014 AHA/ACC guidelines,7,8 the overall rate of interventions scheduled or performed was documented to be significantly lower in female patients (OR, 0.72; 95% CI 0.58; 0.90; P = .004). Particularly in women with MS (OR, 0.38; 95% CI 0.15; 1.00; P = .049) and primary MR (OR, 0.60; 95% CI 0.38; 0.96, P = .034), the analysis showed a significantly lower rate of interventional treatment in concordance with respective guidelines after adjustment for the EuroSCORE II (Figure 2B).
Table 3, block "Intervention scheduled or performed among concordant patients" (columns: crude women OR [95% CI] | adjusted women OR [95% CI] | P-value adjusted OR | number of obs used):
All patients, n = 2000 | 0.74 [0.60;0.91] | 0.72 [0.58;0.90] | .004 | 1831 (91.6%)
Mitral stenosis, n = 168 | 0.46 [0.20;1.08] | 0.38 [0.15;1.00] | .049 | 157 (93.5%)
Primary mitral regurgitation, n = 414 | 0.64 [0.42;0.98] | 0.60 [0.38;0.96] | .034 | 380 (91.8%)
Methods, "Statistical analysis":
A two-sided P-value of <.05 was considered statistically significant.
Results, "Clinical management strategies", first paragraph:
The interaction between sex and type of valve disease was not statistically significant across all analyses.
What the paper's own numbers show
Method. For each odds ratio in Table 3 I reconstructed the standard error of log OR from the printed 95% CI, SE = [ln(upper) − ln(lower)] / (2 × 1.96), and computed a two-sided Wald P from z = ln(OR) / SE. Because the OR and CI limits are rounded to two decimals, I computed z two ways: from the printed point OR, and from the CI midpoint on the log scale. The spread between the two shows the effect of rounding. I also inverted the calculation to find how narrow the CI would have to be, at the printed point estimate, for P to fall below .001. Every number below is printed by recompute.py.txt. Exact regression results cannot be reproduced without individual-level data, which are not published.
| Quantity | Location | Reported | Recomputed from the paper's own numbers |
|---|---|---|---|
| P, concordant MS, adjusted | Abstract | < .001 | — |
| P, concordant MS, adjusted | Results p3; Table 3 | .049 (OR 0.38 [0.15;1.00]) | .046 (point OR) to .050 (CI midpoint); SE 0.484, z = −2.00 |
| P, concordant primary MR, adjusted | Abstract | < .001 | — |
| P, concordant primary MR, adjusted | Results p3; Table 3 | .034 (OR 0.60 [0.38;0.96]) | .031 to .033; SE 0.236, z = −2.16 |
| |z| implied by the printed P | derived | .049; .034; .001 | 1.97; 2.12; 3.29 |
| CI needed for P < .001 at the same OR, MS | derived | 0.15–1.00 | no wider than 0.21–0.68 (SE ≤ 0.294; 1.65 times narrower) |
| CI needed for P < .001 at the same OR, primary MR | derived | 0.38–0.96 | no wider than 0.44–0.81 (SE ≤ 0.155; 1.52 times narrower) |
| P, concordant MS, crude | Table 3 | OR 0.46 [0.20;1.08], no P printed | .071 to .075 |
| P, concordant primary MR, crude | Table 3 | OR 0.64 [0.42;0.98], no P printed | .039 to .040 |
| P, concordant all patients, adjusted | Results p3; Table 3 | .004 (OR 0.72 [0.58;0.90]) | .0034 to .0037 |
| P, all interventions scheduled/performed, MS, adjusted | Table 3 | NS (OR 0.62 [0.30;1.27]) | .19 |
| P, all interventions scheduled/performed, primary MR, adjusted | Table 3 | NS (OR 0.88 [0.64;1.20]) | .41 to .43 |
| P, transcatheter approach, MS, adjusted | Table 3 | .027 (OR 3.53 [1.15;10.82]) | .027 |
| P, intervention withheld, MS, adjusted | Table 3 | NS (OR 2.42 [0.91;6.42]) | .076 to .077 |
| Ratio of printed P to the abstract's bound | Table 3 vs Abstract | .049 and .034 vs .001 | 49 and 34 |
The Table 3 P-values agree with the printed confidence intervals to within rounding, as do the other rows checked (all patients, transcatheter MS). The table and the Results text are therefore consistent with each other. The abstract is the only place that gives P < .001 for MS or primary MR. To reach that level at the printed point estimates, the standard errors would have to be about 1.5 to 1.65 times smaller than the published CIs imply, which corresponds to roughly 2.3 to 2.7 times as much statistical information.
Figure
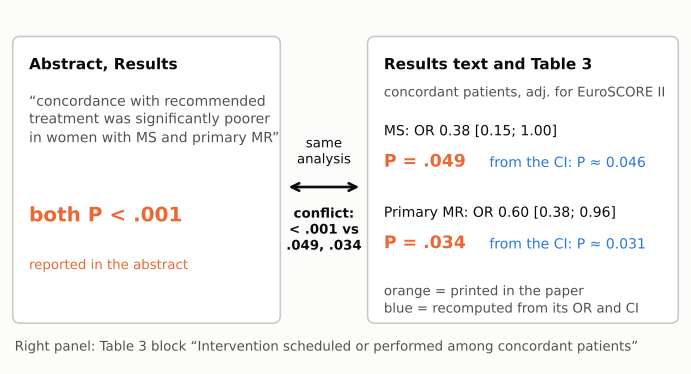
Figure 1. The conflicting statements side by side. Left: the abstract's Results sentence, which gives "both P < .001" for MS and primary MR. Right: the same analysis as reported in the Results text and the concordant-patient block of Table 3 (adjusted for EuroSCORE II), with the printed ORs, 95% CIs and P-values in orange. The blue values are Wald P-values recomputed from those printed ORs and CIs by recompute.py.txt; they agree with Table 3.
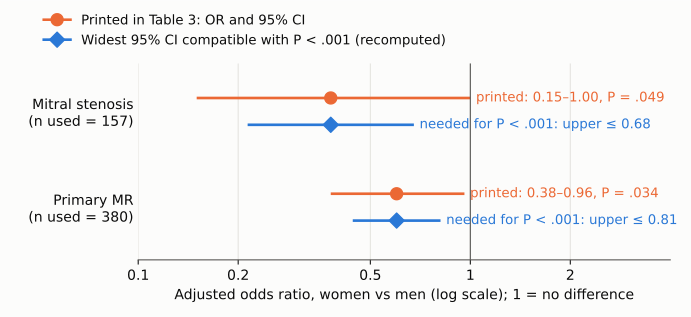
Figure 2. Adjusted odds ratio (women vs men) for intervention scheduled or performed among patients with a concordant class I indication, on a log scale. The vertical line marks OR = 1. Orange: the OR and 95% CI printed in Table 3. Blue: at the same point estimate, the widest symmetric (on the log scale) 95% CI that would give a two-sided Wald P below .001, as computed by recompute.py.txt. The printed intervals are much wider than an abstract value of P < .001 would require, and the MS interval reaches 1.00.
Why it matters
- The abstract misstates the strength of evidence for a headline finding. Conclusion (ii), "concordance with recommended intervention for MS and primary MR was significantly lower for women", is one of three conclusions in the abstract and rests on these two results. Readers who rely on the abstract, or on indexing services that reproduce it (the PubMed abstract carries the same "both P < .001"), are told the evidence is strong. The paper's own analysis puts it close to the .05 threshold.
- The direction and nominal significance do not change. Both adjusted ORs are below 1 and both printed P-values are below the paper's stated alpha of .05. The conclusion survives as worded. What changes is how strong the evidence is: P ≈ .05 and P ≈ .03, not P < .001.
- The results are fragile in ways the abstract does not show. The MS upper confidence limit is 1.00. The crude MS estimate (OR 0.46 [0.20;1.08]) is not significant (P ≈ .07). The concordant-patient block of Table 3 reports four valve-type subgroups (AS, AR, MS, primary MR). A Bonferroni adjustment for those four would give about .20 for MS and .14 for primary MR. The paper did not prespecify such an adjustment, so this is context, not a re-analysis. The paper also reports that the sex-by-valve-type interaction "was not statistically significant across all analyses", which limits how far the MS and primary MR subgroups can be singled out from the others.
- The Discussion builds on the subgroup findings. It offers explanations for why "Class I indications to intervene on women with primary MR were significantly less often followed" and notes that "Similarly to MR, women with concordant indications for the treatment of MS were also less likely to undergo intervention." These passages give no P-values and are consistent with the Table 3 values. A reader who weighs them against the abstract's P < .001 would overrate how secure the subgroup differences are.
Explanations considered
- The abstract refers to the crude rather than the adjusted model. Not supported. The crude ORs are weaker: MS 0.46 [0.20;1.08] gives P ≈ .07 and primary MR 0.64 [0.42;0.98] gives P ≈ .04.
- The abstract refers to a different outcome for MS and primary MR. Not supported. In Table 3, "Intervention scheduled or performed" across all patients is NS for both MS (0.62 [0.30;1.27]) and primary MR (0.88 [0.64;1.20]). Transcatheter approach for MS is P = .027, transcatheter approach for MR is NS, and intervention withheld is NS for both MS and MR. The only P < .001 entries in Table 3 are two all-patient rows (transcatheter approach, OR 1.39; intervention withheld, OR 1.45), and neither is specific to MS or primary MR or concerns concordance.
- The abstract refers to the pooled concordance result or to an interaction test. Not supported. The pooled concordant-patient OR is 0.72 [0.58;0.90], P = .004, which is also not below .001. The Results state that the sex-by-valve-type interaction was not significant in any analysis.
- A different significance convention or one-sided test. Not supported. The Methods state a two-sided P < .05 threshold and no other convention. A one-sided test would halve the P-values to about .025 and .017, still far from .001.
- Rounding of the printed OR and CI. Can explain only small differences. The P-values recomputed from the rounded values range from .046 to .050 (MS) and .031 to .033 (primary MR), which bracket or sit next to the printed .049 and .034. Rounding cannot move them by a factor of 34 to 49.
- A conversion or typesetting artifact in the archived text. Ruled out. The publisher's version of record, the Europe PMC full-text XML and the PubMed abstract all read "both P < .001" in the abstract, and all give .049 and .034 in the Results and Table 3 (see Status).
- The paper's figures support P < .001. Not supported. According to the version-of-record check, Figure 2B and panel B of the Structured Graphical Abstract mark MS 0.38 and primary MR 0.60 with a single asterisk, which their legend defines as p < 0.05, with three asterisks reserved for p < 0.001. The figures agree with Table 3.
- A correction already issued. None found (see Status).
Status
- Version of record. The publisher's page (doi.org resolves to academic.oup.com, Eur Heart J 45(37):3818) has the same abstract sentence, "(both P < .001)", the same Results paragraph (P = .049 and P = .034) and the same Table 3 rows. The Europe PMC full-text XML and the PubMed abstract (PMID 39212374) agree. Every quotation above was checked verbatim against the PMC-archived text with
src/show.py. - Supplements. The Europe PMC supplementary bundle for PMC11452747 holds only figure images (the Structured Graphical Abstract and Figures 1 to 4). It has no data supplement and no further analysis of MS or primary MR. No individual-level data are published.
- Corrections and comments. As of 2026-10-24 I found no correction, erratum, corrigendum, expression of concern or retraction.
src/known.pyreturns no Crossref update relations, no PMC notices and no Europe PMC notices. The Crossref record has no update-to or updated-by entries. The only CommentsCorrections link on the PubMed record is a companion editorial (doi:10.1093/eurheartj/ehae524). The PubPeer API returned no record (HTTP 404) for the DOI, and a web search for the title together with "PubPeer" found no thread. - Sources. PMC article PMC11452747; publisher page via https://doi.org/10.1093/eurheartj/ehae523; Europe PMC full-text XML and supplementary files; PubMed record 39212374; Crossref; PubPeer.
Suggested correction
In the abstract, replace
concordance with recommended treatment was significantly poorer in women with MS and primary MR (both P < .001).
with
concordance with recommended treatment was significantly poorer in women with MS (OR 0.38, 95% CI 0.15–1.00, P = .049) and primary MR (OR 0.60, 95% CI 0.38–0.96, P = .034).
The Results text, Table 3, Figure 2B and the Structured Graphical Abstract already give these values and would not need to change.