← Back to the plain-language case
Abstract reports a same-day A&E increase after locum consultations; Table 3 and Results report none
BMC Med (2024) · doi:10.1186/s12916-024-03332-z · PMC10967114
Summary
The abstract says consultations with locum GPs were "4% more likely to be followed by an A&E visit on the same day (OR = 1.04 (1.01 to 1.08))", an interval that excludes 1. The paper's own model output gives a different result for the same outcome and the same adjusted model. Table 3 reports OR 1.02 (0.98 to 1.07), p = 0.331, Additional file 2 (Table S19) reports 1.023 (0.977 to 1.073), and the Results text says there was "no difference in rates of the same day A&E visits". The interval in the abstract implies p ≈ 0.022, while the interval in Table 3 implies p ≈ 0.38, consistent with the printed 0.331. No table in the paper or its supplement contains 1.04 (1.01 to 1.08). As a result, the abstract lists a harm signal that the analysis does not support. The paper's overall conclusion of no systematic difference is not affected.
What the paper reports
Abstract, Results:
Consultations with locum GPs were 22% more likely to involve a prescription for an antibiotic (OR = 1.22 (1.21 to 1.22)), 8% more likely to involve a prescription for a strong opioid (OR = 1.08 (1.06 to 1.09)), 4% more likely to be followed by an A&E visit on the same day (OR = 1.04 (1.01 to 1.08)) and 5% more likely to be followed by an A&E visit within 1 to 7 days (OR = 1.05 (1.02 to 1.08)).
Table 3, "Mixed effects logistic regression for patient outcomes and potentially hazardous prescribing indicators over time, odds ratios", rows 7 and 8:
A&E visits, same day | 1.02 (0.98 to 1.07), < 0.331 [0.028]
A&E visits, within 1 to 7 days | 1.05 (1.02 to 1.08), < 0.001 [0.015]
Results, paragraph 3:
In terms of hospital-related outcomes, a consultation with a locum was 5% more likely to be followed by an A&E visit within 1 to 7 days (OR = 1.05, 95% CI 1.02 to 1.08) but there was no difference in rates of the same day A&E visits, emergency admissions or ACSC emergency admissions.
Results, paragraph 4, which points to the full model output:
The full output from the multilevel regressions is presented in Table S18–S22 in Additional file 2.
Additional file 2, Table S19, "Locum consultations" row, column "A&E visits, same day". The docx prints the < before the p-value as in Table 3:
1.023 (0.977 to 1.073),<0.331[0.028]
Additional file 2, Table S23, sensitivity analysis excluding 2020–2022:
A&E visits, same day | 1.02 (0.97 to 1.07), <0.408 [0.026]
Fig. 1 caption. The figure plots the patient-outcome ORs on a linear axis. Read from pixel positions in the publisher's image (calibrated on the .8 to 1.2 gridlines, about ±0.003), same-day A&E is about 1.021 (0.972 to 1.072), with an interval crossing the dashed line at 1.
Coefficient plot for locum consultations across all outcomes. Note: Results are expressed as odd ratios (OR) and corresponding confidence intervals (CI). When the corresponding CIs cross the dashed vertical line coefficients are not statistically significant
Methods, "Model covariates":
Stata v17 was used for data cleaning, management and analyses and an α level of 1% was used throughout [35].
Abstract, Conclusions:
Despite existing concerns, the clinical practice and performance of locum GPs did not appear to be systematically different from that of permanent GPs.
What the paper's own numbers show
Method. For each printed version of the same-day A&E estimate, I recovered the log-scale standard error from the 95% CI, SE = (ln upper − ln lower) / (2 × 1.959964). I then computed z = ln(OR) / SE and the two-sided Wald p-value. I compared these with the p-values the paper prints, with the Results text and with the paper's stated α of 1%. I also compared every OR in the abstract with Table 3, the Results text and the three-decimal model output in Additional file 2 (Tables S18–S20 and S23). I read selected estimates in the paper's Fig. 1 from pixel positions in the publisher's image (linear axis calibrated on its gridlines; precision about ±0.003). As a final check, I computed crude odds ratios from the counts in Table 1. recompute.py.txt prints every number below.
| Quantity | Location | Reported | Recomputed from the paper's own numbers |
|---|---|---|---|
| Same-day A&E, adjusted OR | Abstract (Results) | 1.04 (1.01 to 1.08), "4% more likely" | interval excludes 1; SE(log) 0.0171, z 2.29, p ≈ 0.022; not significant at the paper's α = 1% |
| Same-day A&E, adjusted OR | Table 3, row 7 | 1.02 (0.98 to 1.07), p 0.331 | interval includes 1; SE(log) 0.0224, z 0.88, p ≈ 0.38 |
| Same-day A&E, adjusted OR (3 dp) | Additional file 2, Table S19 | 1.023 (0.977 to 1.073), p 0.331 | p ≈ 0.34; rounds to Table 3's 1.02 (0.98 to 1.07) |
| Same-day A&E, excluding 2020–2022 | Additional file 2, Table S23 | 1.02 (0.97 to 1.07), p 0.408 | p ≈ 0.43; not the abstract value either |
| Same-day A&E | Results, paragraph 3 | "no difference" | agrees with Table 3 and S19, contradicts the abstract |
| Same-day A&E | Fig. 1 | digitised ≈ 1.021 (0.972 to 1.072), interval crosses OR = 1 | agrees with Table 3 and S19, not with the abstract |
| A&E within 1–7 days | Abstract; Table 3; Results; S19 | 1.05 (1.02 to 1.08) everywhere; S19 1.052 (1.022 to 1.082) | z 3.48, p ≈ 5.0 × 10⁻⁴ (printed < 0.001); consistent in all places |
| Same-day A&E, crude | Table 1 | 37,861 (0.31%) permanent vs 4,723 (0.35%) locum | implied denominators 12,334,156 and 1,367,257; crude OR 1.126, which is neither 1.04 nor 1.02 (the abstract describes an adjusted model) |
| Absolute difference at the permanent-GP rate (0.307%) | derived | — | OR 1.04: +0.0122 percentage points (12.2 per 100,000 consultations); OR 1.02: +0.0061 (6.1 per 100,000) |
| Antibiotics | Abstract vs Table 3 vs text vs S18 | 1.22 (1.21 to 1.22) vs 1.21 (1.21 to 1.22) vs 1.21 (1.20 to 1.22) vs 1.213 (1.207 to 1.220) | abstract point estimate is not the rounded model output; the text's lower limit differs from Table 3 |
| Practice revisits | Abstract vs Table 3 vs text vs S18 vs S23 vs Fig. 1 | 0.88 (0.87 to 0.88) vs 0.88 (0.88 to 0.89) vs 0.88 (0.88 to 0.91) vs 0.884 (0.878 to 0.891) vs 0.87 (0.87 to 0.88) vs digitised ≈ 0.877 (0.871 to 0.884) | abstract interval matches none of the main-analysis tables; it matches the S23 interval and Fig. 1 as plotted |
| Hypnotics | Abstract vs Table 3 vs S18 vs Fig. 1 | 0.96 (0.94 to 0.98) vs 0.97 (0.95 to 0.99) vs 0.967 (0.946 to 0.988) vs digitised ≈ 0.962 (0.941 to 0.984) | abstract does not match the rounded model output; Fig. 1 sits closer to the abstract |
| Tests | Abstract vs Table 3 vs S20 | 0.81 (0.80 to 0.82) vs 0.80 (0.80 to 0.81) vs 0.805 (0.796 to 0.814) | 0.805 is a rounding tie for the point; the abstract's upper limit 0.82 does not match 0.814 |
| Prescribing safety indicators | Abstract vs Methods and Table 3 | "eight out of the eleven" not different | Methods define 10 indicators and Table 3 lists A–J; 3 (A, D, H) have p < 0.01, so 7 of 10 are not different |
The same-day A&E estimate is printed in five places. Four of them (Table 3, Table S19, Fig. 1, the Results text) agree with each other: the estimate is about 1.02, its interval spans 1, and p is about 0.33 to 0.38. The abstract alone gives 1.04 with an interval that excludes 1. No version of the model in the paper or its supplement, including the sensitivity analysis, produces 1.04 (1.01 to 1.08). Rounding the three-decimal supplement values reproduces Table 3 for every clinical-practice outcome except tests, where 0.805 is a rounding tie. The abstract differs from those values for five of the eight outcomes (practice revisits, antibiotics, hypnotics, tests and same-day A&E), and only for same-day A&E does the difference change whether the interval includes 1.
Figure
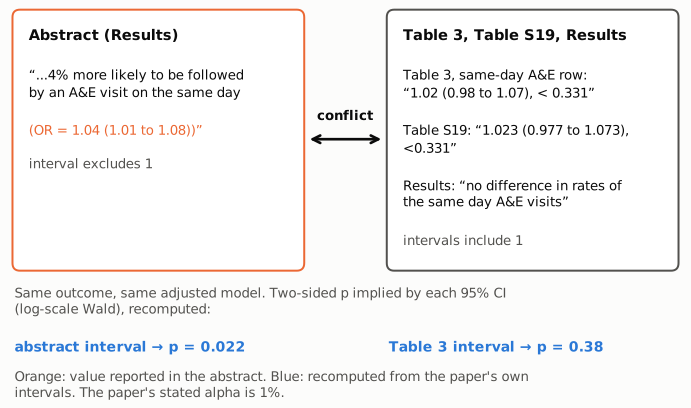
Figure 1. The two conflicting statements about the same outcome (same-day A&E visits after a locum consultation) under the same adjusted model. Left (orange): the abstract's reported OR, whose 95% interval excludes 1. Right: Table 3 (same-day A&E row; the row label is outside the quotation marks), Additional file 2 Table S19 and the Results text, whose intervals include 1 and which describe no difference. Bottom (blue): the two-sided p-values implied by each printed interval on the log scale, recomputed by recompute.py.txt (0.022 and 0.38). The paper prints p = 0.331 for Table 3. All excerpts are verbatim.
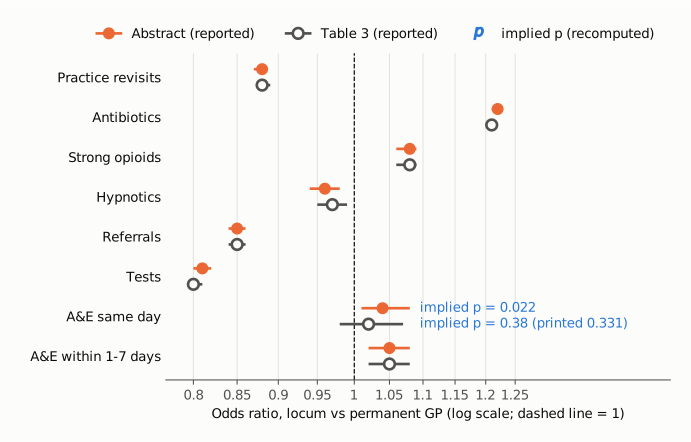
Figure 2. ORs and 95% CIs for locum vs permanent GP consultations, as reported in the abstract (orange, filled) and in Table 3 (gray, open), on a log scale with a dashed line at OR = 1. For same-day A&E, the abstract's interval lies entirely above 1 and Table 3's spans it. The blue labels give the p-values implied by each same-day A&E interval, recomputed, each level with its own marker; Table 3 prints p = 0.331. The abstract's point estimates for antibiotics, hypnotics and tests, and its revisit interval, also differ slightly from Table 3, but none of these differences changes which side of 1 an interval falls on. Same-day A&E is the only outcome where the significance reading changes. A&E within 1–7 days agrees in both places. The figure shows only numbers printed in the paper and p-values computed from them; it does not reproduce the paper's Fig. 1.
Why it matters
- The abstract lists a harm signal that the analysis does not support. The abstract counts both same-day and 1–7 day A&E visits among the outcomes more frequent after locum consultations. Only the 1–7 day effect (OR 1.05, 1.02 to 1.08, p < 0.001) is supported by Table 3, Table S19, Fig. 1 and the Results text. Many readers, including indexers and those who cite the paper, see only the abstract.
- On the paper's own criterion the abstract's figure would not qualify even at face value. The Methods set α at 1%. The interval in the abstract implies p ≈ 0.022, so the paper's threshold would not count it as a difference. The Table 3 value (p = 0.331) clearly does not meet it either.
- The size involved is small and the main conclusion is unchanged. At the permanent-GP rate of 0.307%, OR 1.04 corresponds to about 12 extra same-day A&E visits per 100,000 consultations, and OR 1.02 to about 6. The paper's conclusion that locum and permanent GPs are not systematically different does not rest on this outcome. Correcting it moves one secondary outcome from "higher after locum" to "no difference", so if anything the conclusion becomes slightly stronger.
- The abstract was not reconciled with the final model output. The other abstract values that do not match Table 3 (antibiotics, practice revisits, hypnotics, tests, and "eight out of the eleven" safety indicators) are each small, and none changes an interpretation. They do mean that the abstract's numbers cannot be relied on to the second decimal.
Explanations considered
- A different model, subset or outcome definition. Not supported. The abstract and Table 3 both describe the multi-level mixed-effects logistic regression adjusted for patient and practice characteristics. The Methods define a single same-day A&E variable ("Two binary variables were created indicating whether there was an A&E visit on the same day or within 1 to 7 days"). The only other model reported is the sensitivity analysis excluding 2020–2022 (Table S23), which gives 1.02 (0.97 to 1.07), p 0.408.
- An earlier version of the analysis. Possible, but it cannot rescue the abstract value. The abstract's practice-revisit interval (0.87 to 0.88) matches Table S23 rather than Table 3, and the "eleven" indicators conflict with the 10 defined in Methods. The paper's Fig. 1 also appears to plot output other than Tables 3 and S18: read from pixel positions, its hypnotics estimate is about 0.962 (0.941 to 0.984), close to the abstract's 0.96 (0.94 to 0.98) rather than Table 3's 0.97 (0.95 to 0.99), and its practice-revisit estimate is about 0.877 (0.871 to 0.884), close to the abstract's 0.88 (0.87 to 0.88) rather than S18's 0.884 (0.878 to 0.891). These point to the abstract and Fig. 1 drawing at least in part on output other than the final main models. But even Fig. 1, which shares these abstract values, shows same-day A&E at about 1.02 (0.97 to 1.07), not 1.04 (1.01 to 1.08). No reported output, table or figure, gives the abstract's same-day A&E value.
- Crude rather than adjusted estimate. Not supported. The crude OR from Table 1 counts is 1.126, which is far from 1.04, and the abstract says the models control for patient and practice characteristics.
- Rounding. Not able to explain it. The three-decimal output 1.023 (0.977 to 1.073) rounds to 1.02 (0.98 to 1.07). No rounding turns a lower limit of 0.977 into 1.01.
- Table 3 is the value in error rather than the abstract. Not supported. Table 3 agrees with the full regression output in Table S19, with the same-day A&E estimate plotted in Fig. 1 (about 1.021, 0.972 to 1.072) and with the Results text, and its printed p = 0.331 is consistent with its own interval (implied p ≈ 0.34 from the three-decimal interval). The abstract is the only place where the 1.04 value appears.
- A text-conversion artifact in PMC. Ruled out. A previous check opened the publisher's version of record on Springer Nature Link, the publisher's Table 3 page and the Europe PMC full-text XML. All of them have the same abstract wording, the same Results sentence and the same Table 3 row.
- Side observations, not part of the main finding. The Table 3 footer says results "are reported as incidence rate ratios (IRR)", while the table title, Fig. 1 and the abstract say odds ratios. The p-values are printed with a leading "<" (for example "< 0.331"), although they appear to be exact values. The Discussion gives the A&E visit rate as "0.15%", while Table 1 gives 0.31% (same day) and 0.39% (1–7 days) for permanent GPs; 0.15% is close to the rates Table 1 prints for emergency and ACSC admissions (0.14% to 0.16%). None of these affects a conclusion.
Status
- Version of record. A previous check opened the publisher's article page (Springer Nature Link / BMC Medicine, vol 22, article 126, published 27 March 2024) in headless Chromium, because plain requests met a JavaScript challenge. The abstract has "4% more likely to be followed by an A&E visit on the same day (OR = 1.04 (1.01 to 1.08))". The Results text has "no difference in rates of the same day A&E visits". The publisher's Table 3 page has "A&E visits, same day 1.02 (0.98 to 1.07), < 0.331 [0.028]". So the mismatch is in the version of record itself. I checked every quotation above verbatim against the PMC-archived text with
src/show.py. - Supplements. I downloaded Additional file 2 (
12916_2024_3332_MOESM2_ESM.docx) from Springer static content and extracted its text. Table S19 gives same-day A&E 1.023 (0.977 to 1.073), p 0.331, and Table S23 gives 1.02 (0.97 to 1.07), p 0.408. Tables S18–S20 give the three-decimal values used above. The abstract's values 1.04 (1.01 to 1.08), 1.22, 0.96 (0.94 to 0.98) and 0.81 (0.80 to 0.82) appear nowhere in the file, nor in the paper's tables. The paper's Fig. 1, as plotted, does sit close to the abstract's hypnotics value 0.96 (0.94 to 0.98) and revisit interval; it does not show 1.04 (1.01 to 1.08) for same-day A&E. A previous check also opened Additional file 1 (12916_2024_3332_MOESM1_ESM.xlsx), which holds code lists only. - Corrections and comments. As of 2026-10-24, I found no correction, erratum, retraction or expression of concern.
src/known.pyreturns no Crossref update relations, no PMC notices and no Europe PMC notices. A Crossrefupdates:filter on the DOI returns 0 works, and the Crossref record has no update-to or updated-by relations. The PubMed record (PMID 38532468) has no CommentsCorrections links, and the publisher's article page shows no change history or correction notice. The PubPeer API returned no record (HTTP 404) for the DOI, and a web search found no PubPeer thread or correction. The Europe PMC REST search returned errors on repeated tries, so I could not query it directly; its notices were covered throughsrc/known.py. - Sources. PMC article PMC10967114; https://doi.org/10.1186/s12916-024-03332-z (Springer Nature Link article page and Table 3 page); Additional files 1 and 2 from static-content.springer.com; Europe PMC full-text XML; Crossref API; PubMed; PubPeer.
Suggested correction
The final model output (Table 3, Table S19 and the Results text), together with the same-day A&E estimate plotted in Fig. 1, supports the following edit to the abstract's Results. Replace
8% more likely to involve a prescription for a strong opioid (OR = 1.08 (1.06 to 1.09)), 4% more likely to be followed by an A&E visit on the same day (OR = 1.04 (1.01 to 1.08)) and 5% more likely to be followed by an A&E visit within 1 to 7 days (OR = 1.05 (1.02 to 1.08)).
with
8% more likely to involve a prescription for a strong opioid (OR = 1.08 (1.06 to 1.09)) and 5% more likely to be followed by an A&E visit within 1 to 7 days (OR = 1.05 (1.02 to 1.08)).
and replace
We found no evidence that emergency admissions, ACSC admissions and eight out of the eleven prescribing safety indicators were different
with
We found no evidence that same-day A&E visits, emergency admissions, ACSC admissions and seven out of the ten prescribing safety indicators were different
The authors may also wish to bring the abstract's other estimates in line with Table 3 (antibiotics 1.21 (1.21 to 1.22), with the percentage changed to 21%; practice revisits 0.88 (0.88 to 0.89); hypnotics 0.97 (0.95 to 0.99), 3%; tests 0.80 (0.80 to 0.81), 20%). They may also wish to align the Results text's revisit interval (0.88 to 0.91), antibiotic interval (1.20 to 1.22) and hypnotic interval (0.94 to 0.99) with Table 3, and to check that Fig. 1 plots the final model output for hypnotics and practice revisits. If instead the authors' final model gives 1.04 (1.01 to 1.08) for same-day A&E, then Table 3, Table S19, the same-day A&E estimate in Fig. 1 and the Results sentence would all need correcting, and the abstract should say that the estimate does not meet the paper's 1% α.