← Back to the plain-language case
Mediation effect called significant although its reported 95% CI includes zero and P = 0.146
Sci Adv (2022) · doi:10.1126/sciadv.abq3211 · PMC10936045
Summary
The Results state that a mediation analysis "revealed a significant indirect effect" of the CDA set-size effect on the link between 1064-nm tPBM and working-memory capacity, but the statistics printed with that sentence are 0.300, 95% CI −0.107 to 0.706, P = 0.146. The interval contains zero and agrees with the printed P (a Wald P recomputed from it is 0.148), so by the paper's own test (is zero inside the 95% bootstrap CI?) the indirect effect is not significant; the numbers also match the Fig. 3A paths in a way suggesting they belong to the direct path c′, which would leave the indirect effect (about 0.13 to 0.15) untested. Either way, no statistic in the paper supports the mediation claim stated in the abstract, a Results heading, the Fig. 3 title and the Discussion. The main behavioral result, that K values rose after 1064-nm tPBM, rests on separate tests and is not affected.
What the paper reports
Abstract:
The CDA set-size effect during retention mediated the effect between the 1064-nm tPBM and subsequent WM capacity.
Results, section heading:
CDA mediates the WM improvement with tPBM (1064 nm) applied to the right PFC
Results, same section (the PMC text renders the minus sign as a hyphen; the archived JATS XML has a true minus sign, U+2212, before 0.107):
This mediation analysis revealed a significant indirect effect of the CDA set-size effect (indirect effect: 0.300, 95% confidence interval: -0.107 to 0.706, P = 0.146; direct effect: 0.245, 95% confidence interval: 0.021 to 0.844, P = 0.040).
The mediation analysis demonstrated the indirect effect of 1064-nm tPBM on the behavioral K values through an increase in the amount of information maintained in visual WM, as reflected by increases in the CDA set-size effect.
Results, same section, next sentences:
(r = 0.404, P < 0.001, confidence interval: 0.154 to 0.654; Fig. 3B)
Materials and Methods, "Statistical analysis":
The direct and indirect effects were then obtained by contrasting these two models. The null hypothesis was tested by examining whether zero was within the 95% bootstrap confidence intervals.
Fig. 3 title and legend:
The CDA set-size effect mediated behavioral K values by 1064-nm tPBM.
a, b, and c denote standardized beta coefficients of the direct path strength. c′ denotes the beta coefficient of path strength after controlling for changes in the CDA set-size effect.
*P < 0.05 and **P < 0.01.
Fig. 3A path labels (read from the archived figure image, not reproduced here): a = 0.370*, b = 0.404**, c = 0.433*, c′ = 0.300 (no asterisk).
Discussion, first paragraph:
A mediation analysis revealed that the behavioral enhancements with tPBM were mediated by CDA set-size effects.
Discussion, "Improvement of CDA-identified WM capacity by 1064-nm tPBM on the right PFC":
We further established neurophysiological links between 1064-nm tPBM and subsequent WM capacity, by demonstrating that the CDA during the retention served as a mediator.
What the paper's own numbers show
Method. I first applied the paper's own decision rule to each printed interval: is zero inside the 95% CI? As a consistency check, I then read each interval as estimate ± 1.96 SE, recovered the implied SE, and computed a two-sided Wald P to compare with the printed P. A bootstrap interval need not be symmetric, so this check can only confirm agreement among the numbers; the paper's rule does not depend on it. I also compared the printed estimates and interval midpoints with the path coefficients in Fig. 3A, and computed the indirect effect those paths imply (a × b, and c − c′). Every number below is printed by recompute.py.txt.
| Quantity | Location | Reported | Recomputed from the paper's own numbers |
|---|---|---|---|
| Is the indirect effect significant? | Results, mediation paragraph | "a significant indirect effect" | No: 0 lies inside −0.107 to 0.706, and P = 0.146 > 0.05 |
| Indirect effect: CI midpoint | same | 0.300 (−0.107 to 0.706) | 0.2995; the interval is symmetric about the estimate (0.407 below, 0.406 above) |
| Indirect effect: P | same | 0.146 | implied SE 0.2074, z = 1.446, Wald P = 0.148 (agrees with the printed P) |
| Indirect effect, read one-sided | derived; no one-sided test is stated | — | P = 0.073; 90% CI −0.041 to 0.641 (still contains 0) |
| Direct effect: significant? | same | 0.245, CI 0.021 to 0.844, P = 0.040 | yes: 0 lies outside the CI, and P < 0.05 |
| Direct effect: CI midpoint vs estimate | same | 0.245 | midpoint 0.4325; the estimate is 0.224 above the lower bound and 0.599 below the upper |
| Direct effect: Wald P | same | 0.040 | 0.243 for the stated estimate 0.245; 0.039 for the CI midpoint 0.4325 |
| Printed "indirect" estimate vs Fig. 3A | Results vs Fig. 3A | 0.300 | equals c′ = 0.300, the path after controlling for the mediator (no asterisk) |
| Printed "direct" interval vs Fig. 3A | Results vs Fig. 3A | CI 0.021 to 0.844, P = 0.040 | midpoint 0.4325 equals c = 0.433 (marked *); Wald P 0.039 |
| Indirect effect implied by Fig. 3A | Fig. 3A | not reported | a × b = 0.370 × 0.404 = 0.1495; c − c′ = 0.133; no CI or P for either |
Two readings are possible, and both lead to the same conclusion.
- Take the labels as printed. The indirect effect is 0.300 with a 95% CI that contains zero and P = 0.146. Under the stated rule, the null of no indirect effect is not rejected. The direct effect is significant. A significant direct effect with a non-significant indirect effect does not show mediation.
- Match the numbers to Fig. 3A. The "indirect" estimate and its symmetric interval equal c′ = 0.300, which the figure also leaves unstarred. The "direct" interval and P fit c = 0.433: its midpoint is 0.4325, and a Wald P for 0.433 on that interval is 0.039, against the printed 0.040. The printed point estimate 0.245 lies inside the "direct" interval but far from its center (midpoint 0.4325), and matches no path in Fig. 3A. On this reading, the two sets of statistics belong to the direct path c′ and the total effect c, and the indirect effect itself (a × b ≈ 0.149, or c − c′ = 0.133) is never tested in the paper. The claim of a "significant indirect effect" then has no reported statistic behind it.
Figure
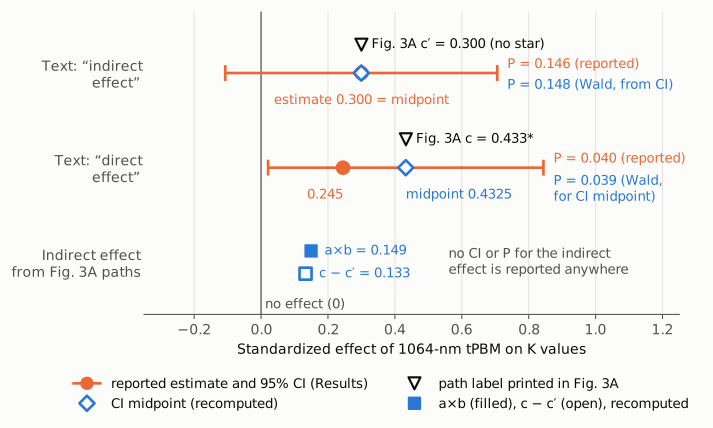
Figure 1. Standardized effects of 1064-nm tPBM on K values, on one linear axis, with zero (no effect) as the thin vertical line. Orange: the estimate and 95% CI printed in the Results for the "indirect effect" (top row) and the "direct effect" (middle row), with the printed P values. Blue diamonds: the interval midpoints recomputed from the printed bounds, with the Wald P implied by each interval. Black open triangles: the path labels printed in Fig. 3A, placed on the row whose interval they match (c′ = 0.300 with the "indirect" interval, c = 0.433 with the "direct" interval). Bottom row, blue squares: the indirect effect implied by the Fig. 3A paths, a × b = 0.149 (filled) and c − c′ = 0.133 (open), for which no CI or P is reported. The "indirect effect" interval crosses zero; its estimate and midpoint coincide with c′; and the "direct effect" estimate 0.245 sits far from its own interval's midpoint, which equals c.
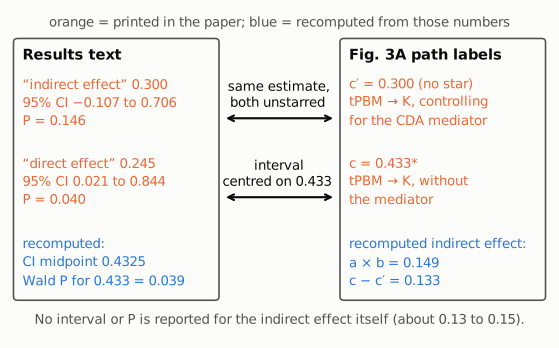
Figure 2. The two statistic sets printed in the Results (left panel) set beside the Fig. 3A path labels (right panel). Orange text is printed in the paper; blue text is recomputed from it. The "indirect effect" estimate equals c′, the tPBM → K path after controlling for the mediator, and neither carries a significance mark. The "direct effect" interval is centered on 0.4325, and a Wald P for c = 0.433 on that interval is 0.039, against the printed P = 0.040. The indirect effect the paths imply, a × b = 0.149 or c − c′ = 0.133, appears nowhere in the paper with an interval or P value.
Why it matters
- A mechanistic claim in the abstract has no statistical support in the paper. The abstract states that the CDA set-size effect "mediated" the effect of 1064-nm tPBM on WM capacity. The same claim appears in a Results heading, the Fig. 3 title, and two places in the Discussion, where it is presented as having "established neurophysiological links" between tPBM and WM capacity. The only indirect-effect statistic printed (CI −0.107 to 0.706, P = 0.146) fails the paper's own test.
- The significance call is reversed, not just loosely worded. Under reading 1 the paper reports a non-significant indirect effect and calls it significant. Under reading 2 it reports no test of the indirect effect and calls it significant. Neither reading allows the conclusion that mediation was shown.
- What is not affected. The behavioral improvement in K values after 1064-nm tPBM (experiment 1: t22 = 2.841, P = 0.009; experiment 2: t17 = 2.760, P = 0.013), the increase in the CDA set-size effect, the correlations between the two, and the null results at 852 nm and over the left PFC come from separate tests that this issue does not touch. The title's conclusion stands on those. A correlation between changes in CDA and changes in K is consistent with mediation, but it is not a test of it.
- The labels in the text also need checking. If reading 2 is right, the numbers labelled "direct effect" are the total effect c, and the stated estimate 0.245 does not belong to the interval printed with it (a symmetric interval of the same width around 0.245 would run from −0.166 to 0.656 and include zero).
Explanations considered
- A typo in the interval or the P value. Ruled out. The interval is centered on 0.300 (midpoint 0.2995), and the Wald P it implies (0.148) matches the printed 0.146. Estimate, interval and P are consistent with each other, and all three indicate a non-significant effect. A dropped minus sign (0.107 instead of −0.107) would not fit: the interval would then not be centered on 0.300, and P would not be near 0.15.
- A one-sided test. No one-sided test is mentioned anywhere. Even one-sided, P = 0.073 and the corresponding 90% interval (−0.041 to 0.641) still contains zero.
- A different significance convention. Ruled out by the paper itself. Methods states that "The null hypothesis was tested by examining whether zero was within the 95% bootstrap confidence intervals." Zero is within the printed indirect-effect interval.
- The words "direct" and "indirect" swapped. Not supported. A swap would make the indirect effect 0.245 with CI 0.021 to 0.844, P = 0.040, which would be significant. But 0.245 matches neither a × b (0.149) nor c − c′ (0.133), and that interval's midpoint and implied P match the total effect c = 0.433 instead. The numbers fit reading 2 (the statistics belong to c′ and c) better than a simple swap.
- Mediation inferred from the pattern of c and c′. Fig. 3A marks c = 0.433 as significant and c′ = 0.300 as not, which some older approaches read as evidence of mediation. The paper does not argue this. Its stated test is the bootstrap CI of the indirect effect, and the change from significant to non-significant is not itself a test of c − c′ (a c′ of 0.300 is 69% of c).
- Joint significance of paths a and b. Fig. 3A marks a (P < 0.05) and b (P < 0.01) as significant, and testing a and b jointly is one recognized way to test mediation. The paper does not use or report it, and its stated criterion is different. If the authors intend this test, it should be stated and reported, with the exact P values for a and b. As a side observation, b = 0.404 is the same value as the zero-order correlation r = 0.404 between CDA and K values reported for Fig. 3B, though in a mediation model b should be the mediator's coefficient after adjusting for session. The two can differ, so the authors may wish to confirm which value Fig. 3A shows.
- A text-conversion artifact. Ruled out. The archived JATS XML carries a true minus sign (U+2212) before 0.107, and the bioRxiv preprint (version 2) prints the same sentence and numbers.
- A correction already issued. None found (see Status).
Status
- Version of record. The publisher's page (science.org, reached through doi.org) returned HTTP 403 to automated requests. I checked the publisher-deposited text in the PMC archive (JATS XML and the PMC HTML page) and the Europe PMC full-text XML, which agree with all passages quoted here. Every quotation was checked verbatim against the PMC-archived text with
src/show.py. The bioRxiv preprint (doi:10.1101/2022.02.24.481703, version 2) has the same mediation sentence and numbers. - Supplements and data. The Supplementary Materials PDF (
sciadv.abq3211_sm.pdf, 4 pages, Figs. S1 to S3 on theta, alpha and beta band activity) does not mention mediation, the indirect effect or a bootstrap. The Fig. 3 image in the same Europe PMC bundle gives the path labels quoted above. The OSF project cited by the paper (doi:10.17605/OSF.IO/67YUS) holds behavioral data, preprocessed EEG files and MATLAB EEG analysis code. It has no mediation syntax or output, so the mediation cannot be rerun from the deposited materials without reprocessing the EEG. - Corrections and comments. As of 2026-10-24 I found no correction, erratum, expression of concern or retraction.
src/known.pyreturns no Crossref update relations and no PMC or Europe PMC notices. The Crossref record has empty update-to and updated-by fields, and the PubMed record (PMID 36459562) has no CommentsCorrections entries. The PubPeer API returned no record (HTTP 404) for the DOI, and a web search for the title with "PubPeer", "correction" or "erratum" found no thread or notice. Crossref links one post-publication peer review on ScienceOpen (doi:10.14293/S2199-1006.1.SOR-UNCAT.A10936045.v1.RIGKMC, deposited 2026-03-16). Its page returned HTTP 403, so I could not tell whether it raises this point. - Sources. https://pmc.ncbi.nlm.nih.gov/articles/PMC10936045 ; Europe PMC full-text XML and supplementary files for PMC10936045; https://www.biorxiv.org/content/10.1101/2022.02.24.481703v2 ; https://doi.org/10.17605/OSF.IO/67YUS ; Crossref; PubMed; PubPeer; https://doi.org/10.1126/sciadv.abq3211.
Suggested correction
In the Results, the sentence
This mediation analysis revealed a significant indirect effect of the CDA set-size effect (indirect effect: 0.300, 95% confidence interval: −0.107 to 0.706, P = 0.146; direct effect: 0.245, 95% confidence interval: 0.021 to 0.844, P = 0.040).
should be checked against the original SPSS output. If those numbers are the indirect and direct effects, the sentence could read "This mediation analysis did not reveal a significant indirect effect of the CDA set-size effect (indirect effect: 0.300, 95% confidence interval: −0.107 to 0.706, P = 0.146), whereas the direct effect was significant (…)". If they are instead the c′ and c paths of Fig. 3A, the labels should be corrected, and the indirect effect (a × b) should be reported with its bootstrap 95% CI. In either case the abstract sentence ("The CDA set-size effect during retention mediated the effect…"), the Results heading, the Fig. 3 title, and the two Discussion sentences on mediation should be revised to match the corrected result. If the bootstrap CI of a × b excludes zero, the mediation claim could be kept with that statistic cited. If it does not, these passages should say that the CDA set-size effect correlated with the behavioral gain but that mediation was not shown. The authors may also wish to confirm that Fig. 3A's b is the mediator's coefficient adjusted for session rather than the zero-order correlation r = 0.404.