← Back to the plain-language case
Table 3's extreme-rainfall columns duplicate the coldwave columns and contradict the text's Cox's Bazar finding
Proc Natl Acad Sci U S A (2023) · doi:10.1073/pnas.2206189120 · PMC10801877
Summary
Table 3 reports, for each of 20 refugee settlements, the national average, the settlement value and their difference for three rapid-onset indicators: heatwaves, coldwaves and extreme rainfall. In the version archived in PubMed Central, every cell of the Extreme rainfall block is identical to the matching cell of the Coldwaves block (20 of 20 rows, 60 of 60 cells). The block is only labelled extreme rainfall. Its values are the coldwave values. As printed, they also run against the paper's text: Cox's Bazar is 0.33 days below the national average (rank 17 of 20), while the abstract, Significance statement, Results and Discussion describe extreme-rainfall exposure there as relatively high (SNR +0.33). The rapid-onset finding singled out in the abstract therefore has no valid settlement-level descriptive data behind it in the paper.
What the paper reports
The headline claim about extreme rainfall:
"We find that refugee populations in the settlements are highly exposed to extreme weather conditions, particularly low rainfall, high temperatures, and extreme rainfall (in the case of Bangladesh)."
— Significance statement
"Our findings for rapid-onset events—heatwaves, coldwaves, and extreme rainfall—are less conclusive compared to country trends, although we find relatively high exposure to extreme rainfall in Cox’s Bazar, Bangladesh."
— Abstract
The text describing the descriptive statistics in Table 3:
"Finally, several settlement locations had extreme rainfall patterns, which were higher than the population-weighted national average, with particularly high scores in Bangladesh."
— Results, Descriptive Statistics
The signal-to-noise results for extreme rainfall:
"Extreme rainfall, which can be used as a proxy for flooding, is most present in Bangladesh, even though we record an SNR of only 0.33. [...] For the other locations, we observe negative SNRs between -2.36 (Jordan) and -5.28 (Ethiopia), indicating that these settlements are in relatively dry, albeit hot regions as compared to the population-weighted national average."
— Results, Signal-to-Noise Analyses
"For extreme rainfall, which with poor water management infrastructure may result in flooding, we identified a significant and notable problem for refugees in Cox’s Bazaar, Bangladesh."
— Discussion
How the SNR's sign is defined:
"We calculate the SNR, a single numeric value, as a ratio between the mean and the SD of the difference: SNR = µ/σ. The SNR can be positive, negative, or equal to zero. A negative SNR means that the national average of a specific indicator is higher than that of the settlement ones. A positive SNR implies the opposite."
— Materials and Methods, Analyses
Table 3, as archived (one row of the 20; the full table is in recompute.py.txt):
| Country | Settlement | Heatwaves: national / settlement / difference | Coldwaves: national / settlement / difference | Extreme rainfall: national / settlement / difference |
|---|---|---|---|---|
| Bangladesh | Cox's Bazar | 1.56 / 1.36 / -0.20 | 1.62 / 1.29 / -0.33 | 1.62 / 1.29 / -0.33 |
"Notes: 1Mean annual max seasonal WSDI or CSDI from 1981-2010. 2 Mean annual number of days with extreme rainfall from 1981-2018."
— Table 3, footnote
What the paper's own numbers show
Method. All 20 rows of Table 3 were transcribed and the Extreme rainfall block was compared with the Coldwaves block cell by cell. In every block, Difference was recomputed as Settlement minus National average, which is the sign convention given in the Methods. Signs and ranks of the extreme-rainfall differences were then read off. Under the paper's definition, SNR = µ/σ with σ > 0, so an SNR always has the same sign as the mean difference. recompute.py.txt prints every number below.
| Quantity | Location | Reported | Recomputed |
|---|---|---|---|
| Extreme rainfall block vs Coldwaves block | Table 3 | Two separately labelled blocks | Identical in 20 of 20 rows, 60 of 60 cells (national average, settlement and difference columns each 20/20) |
| Heatwaves block vs Coldwaves block, and vs Extreme rainfall block | Table 3 | — | 0 of 20 rows identical, so the table as a whole was not duplicated |
| Difference = settlement − national | Table 3, all three blocks | Difference column | Matches within 0.01 (rounding) in all 20 rows of each block, so each block is internally consistent |
| Cox's Bazar, extreme rainfall | Table 3 | 1.62 / 1.29 / -0.33 | 1.29 − 1.62 = −0.33: settlement 20.4% below national |
| Cox's Bazar rank by extreme-rainfall difference | Table 3 | "particularly high scores in Bangladesh" (Results) | 17th of 20 |
| Largest extreme-rainfall differences | Table 3 | — | Dadaab +0.85, Jamjang +0.78, Maban +0.55 |
| Direction for Bangladesh | Results, SNR paragraph; Abstract; Discussion | SNR +0.33, settlement above national | Table difference −0.33. A positive SNR needs a positive mean difference |
| Direction for the other locations | Results, SNR paragraph | All negative, −2.36 (Jordan) to −5.28 (Ethiopia) | 10 of the 19 settlements outside Bangladesh have positive differences. Kenya (+0.85, +0.30) and South Sudan (+0.55, +0.78) are positive at every settlement |
Figure
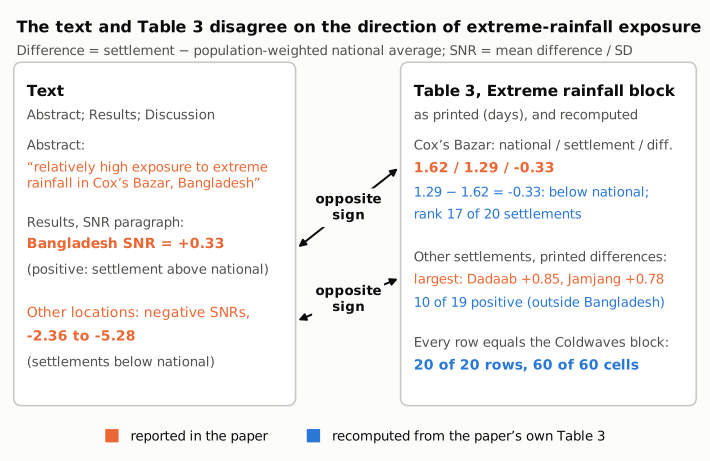
Figure 1. On the left, the paper's text: the abstract reports relatively high extreme-rainfall exposure in Cox's Bazar, and the Results give a Bangladesh SNR of +0.33 (settlement above national) and negative SNRs from −2.36 to −5.28 for all other locations. On the right, the Extreme rainfall block of Table 3 as printed (orange), with values recomputed from it (blue). Cox's Bazar is below the national average (−0.33, rank 17 of 20), 10 of the 19 other settlements are above it, and every row of the block equals the Coldwaves block. All numbers come from the paper's text and Table 3.
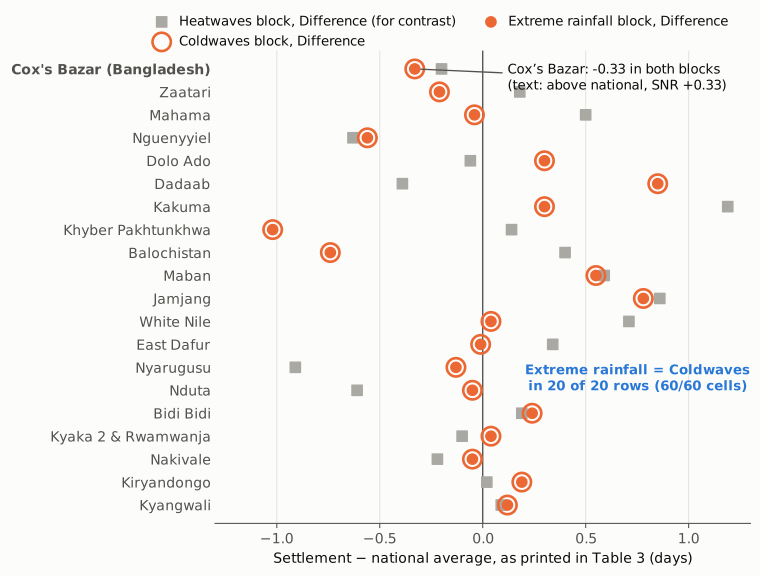
Figure 2. The Difference column of each Table 3 block, one row per settlement. The filled orange dots (extreme rainfall) sit exactly inside the open orange circles (coldwaves) in all 20 rows. The grey squares (heatwaves) are a different block of the same table, shown for contrast: they do not coincide, so only the extreme-rainfall block repeats another. Values are as printed in Table 3, plotted on an untruncated common scale.
Why it matters
- The abstract's only positive rapid-onset finding loses its tabulated support. The Significance statement and Abstract single out extreme rainfall in Cox's Bazar. Table 3 is the paper's only settlement-level descriptive table for rapid-onset events, and its extreme-rainfall block holds coldwave values. Read at face value, it shows the opposite sign for Cox's Bazar.
- Readers cannot recover the correct values from the paper. The paper gives no other settlement-level extreme-rainfall figures. Fig. 3 reports SNRs aggregated by country. A reader who uses Table 3, for example to compare flood-proxy exposure across settlements, gets coldwave durations.
- Several text statements cannot be checked against the table. These include "several settlement locations had extreme rainfall patterns, which were higher than the population-weighted national average" and the claim that the non-Bangladesh settlements are relatively dry. As printed, the table contradicts both.
- What is not affected. The slow-onset results (temperature and rainfall, Table 2) and the heatwave and coldwave blocks of Table 3 are distinct and internally consistent, so the paper's main conclusion about slow-onset exposure does not depend on this error. The country-level SNRs quoted in the text for extreme rainfall may well be right (see below). The problem is that Table 3 does not support them.
Explanations considered
- Text extraction or conversion artifact. Ruled out. The publisher-supplied JATS XML in Europe PMC (fullTextXML, fetched 2026-10-24) has the same duplicated values as the local PMC copy. Minus signs are present, and there are no misaligned cells and no decimal or superscript problems. The duplication is also already present upstream, in the results file of the authors' code repository (below), so it was not introduced in typesetting or archiving.
- The two indicators share a definition, so equal values are expected. Ruled out by the paper itself. Table 4 defines CSDI as the "Number of days per season with at least 6 consecutive days when TN < TN10th" and extreme rainfall as the "Number of days per 10 days when RR > 20mm". The Methods aggregate them differently: "yearly population-weighted maxima (WSDI and CSDI), and yearly population-weighted sums (extreme rainfall [...])". A temperature-based and a precipitation-based index, aggregated differently, cannot agree to two decimals in 60 of 60 cells.
- The text's SNRs and the table measure different things, so a sign difference is possible. This explains only part of the problem. The SNRs are aggregated by country, and the repository figures show that the table's Difference and the figure's mean difference are not computed identically (for coldwaves in Bangladesh, the table has −0.33 and the repository figure has −0.65, but both are negative and the settlement means agree, 1.29 vs 1.28). It does not explain why two different indicators have identical values. Nor does it explain a Bangladesh row, a single settlement, whose extreme-rainfall difference is negative while its SNR is positive.
- The table is right and the text is wrong. Unlikely. The repository's extreme-rainfall panel figure,
figures/floods.pdf, produced by the same plotting function as the other indicator figures, prints the SNRs quoted in the text: Bangladesh +0.33, Jordan −2.36, Ethiopia −5.28. For Bangladesh it gives a mean settlement value of 1.96 days and a mean difference of +0.12 days, not the 1.29 and −0.33 in Table 3. The text is therefore consistent with the authors' extreme-rainfall output. It is Table 3 that departs from it.
Status
As of 2026-10-24:
- Version of record. The publisher pages (pnas.org, reached via doi.org) returned HTTP 403 to automated requests, so the typeset HTML and PDF were not read directly. The publisher-supplied article XML deposited in PMC and served by Europe PMC carries Table 3 with the duplicated block. The PMC copy is the one quoted here.
- Supplements and data. The Data Availability statement points to a 4TU.ResearchData/figshare private link and to a public GitHub code repository (exposure-refugee-camps). The figshare link returned HTTP 202 (browser verification), and the figshare API returned 404 for the private link, so it could not be opened. In the GitHub repository (master branch),
results/descriptive_statistics.csvhas the same structure as Tables 2 and 3. Its Extreme rainfall columns equal its Coldwaves columns in all 60 cells, unrounded: for Bangladesh, 1.6177 / 1.2875 / −0.3302 in both.python recompute.py.txt path/to/descriptive_statistics.csvchecks this. The repository'sfigures/floods.pdfholds the distinct extreme-rainfall values described above. - Corrections. No correction, erratum or retraction notice was found in Crossref, PMC or Europe PMC.
- PubPeer. The PubPeer search API required human verification, so it could not be queried directly. A web search for the title found no PubPeer thread.
Sources: PMC10801877; Europe PMC full-text XML; doi:10.1073/pnas.2206189120; the code repository linked in the paper's Data Availability statement.
Suggested correction
- Replace the Extreme rainfall block of Table 3 (national average, settlement and difference for all 20 settlements) with the values from the extreme-rainfall computation that produced Fig. 3.
- Re-export the corresponding columns of
results/descriptive_statistics.csv. - Re-check the text statements that rest on Table 3 against the corrected values: the Descriptive Statistics paragraph ("several settlement locations [...] higher than the population-weighted national average, with particularly high scores in Bangladesh"), the Abstract and Significance statements on Cox's Bazar, and the Discussion.
- While doing this, reconcile the extreme-rainfall period. Table 3's footnote says "1981-2018" and Table 4 says "1981-2010".