← Back to the plain-language case
Abstract says most muddy coasts erode over 1 m/yr; Table 1 shows 30.5%
Nat Commun (2023) · doi:10.1038/s41467-023-43819-6 · PMC10716179
Summary
The abstract states, and the article's web summary repeats, that "the majority of the world's muddy coasts are eroding at rates exceeding 1 m/yr over the last three decades". The paper's own Table 1 puts 30.5% of muddy coastline in the four erosion classes beyond −1 m/yr, 40.3% in the stable class and 29.2% in the accretion classes. The Results text gives the same split (31%, 40%, 29%) and reports net global accretion of +0.18 m/yr, a gain of 579 km². Eroding coasts are therefore neither a majority nor the largest class. This is one of the two findings the abstract reports, so readers of the abstract alone are told that most muddy coasts are retreating, whereas the paper finds erosion and accretion nearly balanced by length (30.5% vs 29.2%) and a small net gain in area.
What the paper reports
Abstract:
Furthermore, the majority of the world’s muddy coasts are eroding at rates exceeding 1 m/yr over the last three decades.
Web summary (a separate abstract element of type "web-summary" in the archived XML; on nature.com it is the article's description metadata used in search and link previews, not printed on the article page):
14% of the world’s coastlines are muddy and the majority of them are eroding at rates exceeding 1 m per year over the last three decades, according to an automated classification method that identifies global coastlines.
Results, "Dynamics of muddy coasts vs. sandy coasts", second paragraph:
The analysis of coastline dynamics reveals that 40% of the world’s muddy coasts are stable (absolute long-term change rates of <1 m/year over the period 1984–2016); 31% are persistently eroding, while 29% are accreting (Table 1).
On a global scale, the world’s muddy coasts have accreted 0.18 m/year on average over the three decades of the study period, i.e. a total gain of 579 km2 over this period.
Results, same section, first paragraph:
After filtering the muddy coastline transects for a minimum number of historic data points, temporal coverage, potential ice coverage and outliers, 97.7% of the mud coasts remain suitable for further analysis.
Methods, "Dynamic coastline detection":
In addition, the thresholds for accretion and erosion classes have been increased to 1 m/year to focus on the more dynamic muddy shorelines.
Table 1, "Chronic coastline dynamics classification scheme", muddy-coast column (% of muddy coastline): very extreme accretion (>10 m/yr) 8.8; extreme accretion (5 to 10) 5.4; severe accretion (3 to 5) 4.3; intense accretion (1 to 3) 10.7; stable (−1 to 1) 40.3; intense erosion (−1 to −3) 12.2; severe erosion (−3 to −5) 4.8; extreme erosion (−5 to −10) 5.7; very extreme erosion (<−10) 7.8.
What the paper's own numbers show
Method. The abstract's threshold (1 m/yr) is the same as the boundary between the stable class and the erosion and accretion classes in Table 1 and the Methods. So the share of muddy coastline "eroding at rates exceeding 1 m/yr" is the sum of Table 1's four erosion classes. I summed the muddy column by direction, checked that the column totals 100%, bounded the effect of rounding and of the 2.3% of coastline removed by filtering, and computed the one alternative denominator under which erosion is a majority. Every number below is printed by recompute.py.txt.
| Quantity | Location | Reported | Recomputed |
|---|---|---|---|
| Muddy coast eroding > 1 m/yr | Abstract; web summary | "the majority" (> 50%) | 30.5% (12.2 + 4.8 + 5.7 + 7.8) |
| Muddy coast eroding > 1 m/yr | Results, "Dynamics of muddy coasts vs. sandy coasts", para. 2 | 31% | 30.5% (agrees) |
| Muddy coast stable, |rate| < 1 m/yr | Results, same section, para. 2; Table 1 | 40%; 40.3 | 40.3% (the largest class) |
| Muddy coast accreting > 1 m/yr | Results, same section, para. 2; Table 1 | 29% | 29.2% (8.8 + 5.4 + 4.3 + 10.7) |
| Muddy column total | Table 1 | — | 100.0% |
| Eroding share allowing for rounding of the four entries | Table 1 | — | 30.3% to 30.7% |
| Eroding share if all filtered-out coast (2.3%) were eroding | Results, same section, para. 1 | 97.7% retained | at most 32.1% |
| Changing by > 1 m/yr in either direction | Table 1 | — | 59.7% |
| Eroding share among coasts changing by > 1 m/yr only | Table 1 | — | 51.1% (30.5 / 59.7) |
| Accreting minus eroding | Table 1 | — | −1.3 percentage points |
| Global mean change rate of muddy coasts | Results, same section, para. 2 | +0.18 m/yr; +579 km² | not recomputable from the paper; sign is net accretion |
Erosion falls about 20 percentage points short of a majority of all muddy coastline. The only reading that gives a majority is a different denominator, coasts that change by more than 1 m/yr, and even then the majority is 51.1%.
Figure
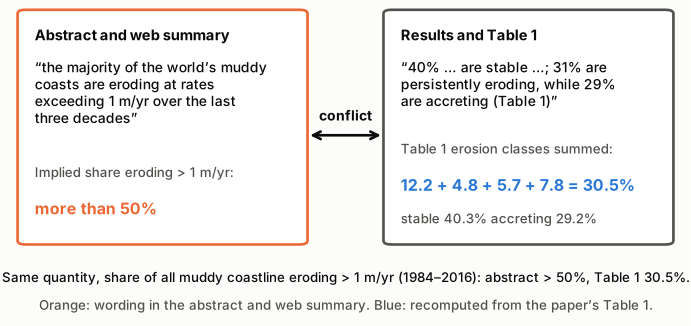
Figure 1. The two statements about the same quantity: the share of all muddy coastline eroding faster than 1 m/yr over 1984–2016. Left (orange outline): the abstract's wording, repeated in the web summary used for search and link previews, which implies more than 50%. Right (grey outline): the Results text and the sum of the four erosion classes of Table 1 (blue, recomputed by recompute.py.txt), with the stable and accretion shares from the same table. The quoted text is abridged with ellipses; the full sentences are given above.
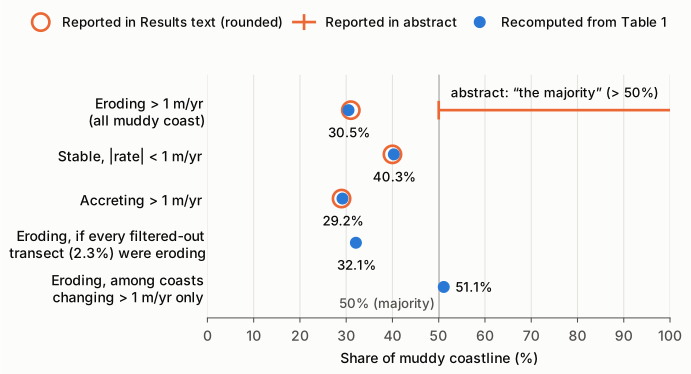
Figure 2. Shares of muddy coastline on a single 0–100% axis. Blue dots are recomputed from Table 1; open orange circles are the rounded values in the Results text; the orange bar from 50% to 100% is the range the abstract's "the majority" implies for the top row. The vertical line marks 50%. The fourth row assigns all of the 2.3% of coastline removed by filtering to erosion, the most favourable case for the abstract. The fifth row changes the denominator to coasts that move by more than 1 m/yr in either direction; it is the only quantity that crosses 50%, and the abstract does not state that restriction.
Why it matters
- It is a headline finding. The abstract reports two results: where muddy coasts are, and how they are changing. The second is stated in the abstract and repeated in the web summary, which nature.com uses as the article's description in search and link previews.
- It misstates the balance of change, not only the size. By length, the body finds erosion and accretion nearly balanced (30.5% vs 29.2%, erosion ahead by 1.3 points), and by net area and mean rate it finds a gain of 579 km² (+0.18 m/yr). The abstract reads as a finding that most muddy coasts are in retreat. Readers who cite the abstract for a "majority eroding" figure would be citing a number the paper does not contain.
- The body and the analysis are consistent. Table 1, the Results text and the net-accretion figure agree with one another. The error is confined to how the abstract summarizes them. The body's point that muddy coasts are more dynamic than sandy ones (59.7% vs 30.2% changing by more than 1 m/yr) is not affected.
Explanations considered
- A different denominator. Partly matches the numbers, but not the wording. Among coasts that change by more than 1 m/yr, eroding coasts are 51.1%, a bare majority. The abstract says "the majority of the world's muddy coasts", with no restriction to changing coasts.
- "Majority" used loosely for "largest group". Does not hold. Stable coast (40.3%) is the largest class; eroding coast (30.5%) is second, ahead of accreting by 1.3 percentage points.
- Rounding. Does not account for it. Each Table 1 entry is printed to one decimal, so the sum of the four erosion entries is uncertain by at most ±0.2 percentage points (30.3% to 30.7%).
- Coastline removed by filtering. Does not account for it. 97.7% of muddy coastline was kept. If every removed stretch were eroding faster than 1 m/yr, the eroding share would be at most 32.1%.
- Net loss rather than share of coastline. Does not hold. The paper reports net accretion of +0.18 m/yr and a 579 km² gain, so a net-change reading also contradicts "eroding".
- A different threshold or unit. Does not hold. The Methods set the erosion and accretion thresholds at 1 m/year, the figure the abstract uses, and Table 1's erosion classes start at −1 m/yr.
- A different period or dataset. Does not hold. The abstract's "last three decades" and the Results' 1984–2016 refer to the same analysis, and the Results sentence cites Table 1 directly.
- "Most muddy coasts are dynamic" written as "eroding". Consistent with the numbers: 59.7% of muddy coastline changes by more than 1 m/yr in one direction or the other. This would explain the wording but would still need a correction, since the published sentence says eroding.
Status
- Version of record. Checked on the publisher's site (nature.com/articles/s41467-023-43819-6, including the separate Table 1 page). The abstract sentence, the web-summary sentence, the Results sentence and the Table 1 values are worded identically to the PMC archive and to the Europe PMC full-text XML. This is not a conversion artifact. On nature.com the visible abstract ends at "...over the last three decades."; the web-summary sentence is not printed on the article page but appears in its description metadata (og:description, twitter:description, and appended to the abstract in the description, dc.description and JSON-LD fields).
- Supplements and data. The Supplementary Information PDF (34 pages) gives no global eroding, stable or accreting percentages and does not restate the majority claim. The source data on Zenodo (doi:10.5281/zenodo.7582197) hold the coast-type classification of 1,826,995 transects but no shoreline change rates, so Table 1 cannot be recomputed from deposited data. The check here is of internal consistency between the abstract and the paper's own Table 1 and text.
- Corrections and comments. None found. Crossref (no update-to or updated-by records), PMC and Europe PMC notices, the article page (no change history or author correction), PubPeer, and a web search for corrections, errata and commentary returned nothing. The Europe PMC search endpoint was unavailable (HTTP 503) at the time of checking; the PMC and Europe PMC notice lookups themselves returned no entries.
- As of 2026-10-24.
Suggested correction
Replace the abstract sentence with one that matches Table 1, for example:
Furthermore, over the last three decades about 31% of the world’s muddy coasts eroded at rates exceeding 1 m/yr, 29% accreted at such rates and 40% were stable, with a small net global gain.
and the web summary with, for example:
14% of the world’s coastlines are muddy; about 60% of them changed by more than 1 m per year over the last three decades, with erosion and accretion roughly balanced, according to an automated classification method that identifies global coastlines.