← Back to the plain-language case
Dorsal attention network mediation reports a negative indirect effect with an entirely positive confidence interval
Hum Brain Mapp (2023) · doi:10.1002/hbm.26474 · PMC10619388
Summary
The paper reports that the temporal variability of the dorsal attention network (DAN) mediates the link between anhedonia and attention in adolescents with major depressive disorder, with "indirect effect = -0.438, 95% confidence interval: [0.926, 1.079]". The estimate is negative but the interval is entirely positive, and the estimate lies 1.364 below the interval's lower bound, which is 17.8 interval half-widths. The paper's own Figure 7c(C) labels −0.438 as the direct path c′, not as the indirect effect. Its path coefficients give an indirect effect of a × b = −0.509 × 0.263 = −0.134, which also lies outside the printed interval. This result is the only inferential support for the fMRI half of the title claim and for an "Importantly" sentence in the Abstract, so as printed that claim has no valid confidence interval. The paper's other mediation result (EEG Microstate C-to-D transition) is internally consistent in the Results text.
What the paper reports
Results, "Network temporal properties associated with MDD", paragraph 4 (the DAN mediation):
Temporal variability in DAN mediated the relationship between anhedonia and attention (direct effect = -0.271; indirect effect = -0.438, 95% confidence interval: [0.926, 1.079]; Figure 7d).
Results, "Network temporal properties associated with MDD", paragraph 3 (the inputs to that mediation):
Correlation analyses revealed that temporal variability was significantly negatively correlated with anhedonia (r = -0.266, p = 0.049; Figure 7c(A)) and positively correlated with attention scores in adolescents with MDD (r = 0.419, p = 0.019; Figure 7c(B)).
Results, "Characteristics of EEG microstate in adolescents with MDD", paragraph 3 (the second mediation, given for comparison):
The transition rate from Microstates C to D mediated the relationship between anhedonia and attention (direct effect = -0.497; indirect effect = -0.389, 95% confidence interval: [-0.571, -0.032], Figure 3c(H)).
Figure 7, caption:
Correlation analyses indicated that the temporal variability was significantly positively correlated with anhedonia and negatively related with attention scores in MDD patients (c(A,B)). Mediation analysis revealed that the temporal variability of DAN mediated the relationship from anhedonia to attention (c(C)).
Figure 7, panel c(C). The panel is an image; these labels were read from the publisher's graphic (Europe PMC file HBM-44-5749-g009.jpg). The paths are a = −0.509 (anhedonia to DAN variability) and b = 0.263 (DAN variability to attention), and the anhedonia-to-attention arrows carry:
−0.438(c′)
−0.572(c)
Bootstrap estimate [95% CI] = −0.271* [0.926, 1.079]
Figure 3, panel c(H) (file HBM-44-5749-g001.jpg). Here a = 0.416 and b = −0.260, and:
-0.389 (c′)
-0.497 (c)
Bootstrap Estimate [95% CI] = 2.241* [-0.571,-0.032]
The finding is stated as a headline result in the Abstract:
Importantly, the temporal variability of DAN mediated the relationship between anhedonia and attention deficits in the patient group.
and in the Discussion, opening paragraph:
Importantly, the dynamic features of the attentional network (transition probability of C-D and temporal variability of the DAN) mediated the relationship between anhedonia and attentional deficits in the patient group.
Discussion, "Adolescent with MDD and network dynamic attributes":
The temporal variability of DAN mediates the relationship between anhedonia and attention.
The title reads "Attention network mediates the association between anhedonia and attentional deficit". The Methods ("Statistical analyses") say that anhedonia was the independent variable, attention the dependent variable and the C-to-D conversion rate the mediator. They do not describe how the mediation confidence intervals were obtained, and they do not mention the DAN mediation model.
What the paper's own numbers show
Method. For each mediation I checked whether the printed estimate lies inside its printed 95% CI. I computed the implied total effect (c = c′ + ab) and proportion mediated from the text, and the indirect effect a × b and c − c′ from the figure's path labels. I checked the sign that a × b must take given the reported correlations and paths. I tested whether any other DAN quantity the paper prints could be the one the interval describes, and whether the coefficients could be standardized. Finally I worked out the sample sizes that the reported r and p values imply. Every number below is printed by recompute.py.txt.
| Quantity | Location | Reported | Recomputed from the paper's numbers |
|---|---|---|---|
| DAN indirect effect vs its CI | Results 3.6 p4 | −0.438, CI [0.926, 1.079] | Outside the CI. 1.364 below the lower bound (17.8 half-widths of 0.0765); CI midpoint 1.0025 |
| Sign-flipped DAN CI | Results 3.6 p4 | [0.926, 1.079] | [−1.079, −0.926] does not contain −0.438 either |
| DAN implied total effect, proportion mediated | Results 3.6 p4 | direct −0.271, indirect −0.438 | c = −0.709, proportion 0.618. Neither lies in the CI |
| DAN indirect effect from figure paths | Fig 7c(C) | a = −0.509, b = 0.263 | a × b = −0.134; c − c′ = −0.572 − (−0.438) = −0.134 (the paths agree with each other) |
| What −0.438 is | Results 3.6 p4 vs Fig 7c(C) | "indirect effect" in text | Labelled c′ (direct path) in the figure |
| What −0.271 is | Results 3.6 p4 vs Fig 7c(C) | "direct effect" in text | Labelled "Bootstrap estimate" in the figure; outside [0.926, 1.079] |
| Any printed DAN quantity inside the CI? | Text and Fig 7c(C) | c, a, b, c′, −0.271, a × b, c′/c (0.766), c/c′ (1.306) | None |
| Sign of the DAN indirect effect | Results p3; Fig 7 caption; Fig 7c(C) | r = −0.266 and +0.419; caption gives the opposite pair; a < 0, b > 0 | a × b < 0 under every source. The negative estimate is the plausible value and the positive CI is not |
| Standardized-coefficient check | derived | indirect −0.438 | If standardized, a × b would be −0.066; Fig 7 a = −0.509 ≠ r = −0.266. The coefficients are unstandardized, so the CI cannot be rebuilt from the text |
| C-D indirect effect vs its CI | Results 3.2 p3 | −0.389, CI [−0.571, −0.032] | Inside; CI negative and excludes 0. Total −0.886, proportion 0.439 |
| C-D indirect effect from figure paths | Fig 3c(H) | a = 0.416, b = −0.260 | a × b = −0.108 = c − c′; inside the CI. The figure's "Bootstrap Estimate" 2.241 lies outside its own CI |
| Sample size behind the DAN correlations | Results 3.6 p3 | r = −0.266, p = 0.049; r = 0.419, p = 0.019 | Consistent only with n = 55 and n = 31 respectively (with n = 188, p would be 2.2 × 10⁻⁴ and 2.2 × 10⁻⁹) |
Figure
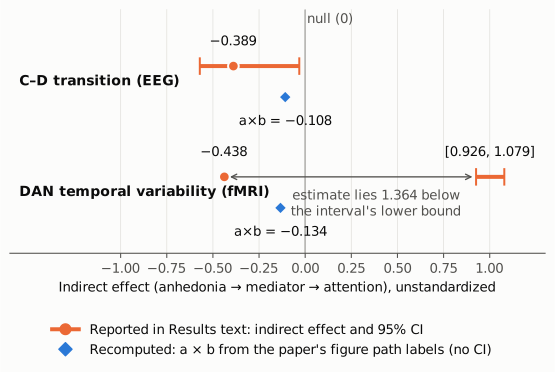
Figure 1. The two mediation results on one axis of unstandardized indirect effect, with the null value 0 as a thin vertical line. Orange circles and bars are the indirect effects and 95% CIs printed in the Results text. Blue diamonds are a × b recomputed from the path coefficients in the paper's Figures 3c(H) and 7c(C); the paper reports no interval for these. For the EEG C-to-D mediation, the printed estimate (−0.389) and the recomputed a × b (−0.108) both lie inside the printed interval. For the DAN mediation, the printed estimate (−0.438) lies 1.364 below an interval that is entirely positive, and the recomputed a × b (−0.134) lies outside it too.
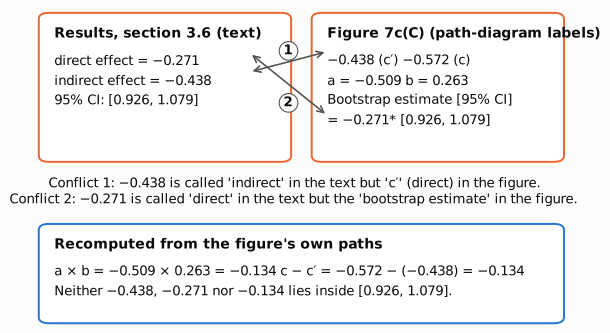
Figure 2. The DAN mediation numbers as printed in the Results text (left) and in the path-diagram labels of the paper's Figure 7c(C) (right), transcribed rather than reproduced. Connector 1: the text calls −0.438 the indirect effect, while the figure labels it c′, the direct path. Connector 2: the text calls −0.271 the direct effect, while the figure labels it the bootstrap estimate. The bottom panel recomputes the indirect effect from the figure's own paths (−0.134). None of the three candidate values lies inside the shared interval [0.926, 1.079].
Why it matters
The title's claim that the "attention network mediates the association between anhedonia and attentional deficit" rests on two analyses: an EEG microstate transition (C to D) and fMRI DAN temporal variability. The DAN result is the only statistical support for the fMRI half of that claim. It appears in the Abstract as an "Importantly" finding and is restated three times in the Discussion. As printed, its 95% CI contradicts its own estimate in sign and location. The paper's figure and text also disagree about which printed number is the indirect effect. A reader cannot tell what the indirect effect is (−0.438, −0.271 or −0.134), what its interval is, or whether that interval excludes zero. The interval is narrow and centred near 1. If it came from a ratio-type quantity, for which 1 is the null, it would include the null. If it belongs to the negative a × b, its true limits are not reported.
The inputs to the mediation are unclear too. The Figure 7 caption reverses the signs of both correlations given in the Results text. One Discussion sentence calls the DAN–attention correlation negative ("the temporal variability of the DAN was significantly negatively correlated with attention scores"), while the Results report r = 0.419. The two r/p pairs fit only n = 55 and n = 31, not the 188 patients enrolled, and the paper does not say which subsample each analysis used. A separate inconsistency: Results paragraph 3 says DAN variability was "significantly higher in adolescents with MDD than in HC (t = 2.582, p = .010)", while the Abstract, the Figure 7 caption and the Discussion say it was weaker.
The EEG C-to-D mediation is unaffected in the text: its estimate lies inside its interval, both negative. It still supports the broader statement that an attention-related dynamic measure mediates the anhedonia–attention link. Its figure, however, prints a "Bootstrap Estimate" of 2.241 outside its own interval, and the figure labels −0.389 as c′ rather than as the indirect effect.
Explanations considered
- The interval belongs to another DAN quantity. No. The direct effect (−0.271), the implied total effect (−0.709), the proportion mediated (0.618), the figure's a (−0.509), b (0.263), c (−0.572), c′ (−0.438) and a × b (−0.134) all lie outside [0.926, 1.079]. So do the ratios c′/c (0.766) and c/c′ (1.306).
- A lost minus sign. No. The negated interval [−1.079, −0.926] does not contain −0.438, −0.271 or −0.134. Also, the publisher's XML carries Unicode minus signs elsewhere in the same sentence but none in this interval, and the figure graphic prints the same positive interval. So this is not a text-conversion artefact.
- Standardized versus unstandardized coefficients. A change of scale cannot move a negative estimate into a positive interval. Standardized coefficients would give a × b ≈ −0.066 in any case, so the printed values are unstandardized.
- Bootstrap asymmetry. Percentile and bias-corrected bootstrap intervals can be asymmetric about the estimate. They still contain the estimate they are built around, and they cannot have the opposite sign to it.
- The interval is for a ratio or exponentiated effect. The interval's midpoint near 1 fits that reading. But the paper reports no such quantity, and exp(−0.134) = 0.875 and exp(−0.438) = 0.645 are both outside the interval. Under that reading the interval would include the null value 1, and the mediation would not be significant.
- A different sign convention in the figure caption. The caption's sign pair (positive with anhedonia, negative with attention) also gives a × b < 0. So no sign convention in the paper makes a positive indirect effect plausible.
- The interval is correct and the estimate is wrong. This cannot be ruled out from the paper alone. Every source in the paper, however, implies a negative indirect effect, so the positive interval is the less plausible number.
Status
- Version of record. The Wiley article page and PDF returned HTTP 403 to automated access. I checked the publisher-deposited full text as archived in PMC and the Europe PMC full-text XML (Wiley JATS). Both carry the quoted values. I read the mediation panels from the publisher's figure graphics in the Europe PMC package (HBM-44-5749-g001.jpg and -g009.jpg).
- Supplements. Neither PMC nor the Europe PMC XML lists supplementary material. The Europe PMC supplementary-files package contains only the article's figure graphics, with no data or supplementary tables.
- Corrections and comments. As of 2026-10-23 I found no correction, erratum, retraction or expression of concern. Crossref lists no update relations for the DOI, and PMC and Europe PMC list no correction or comment links (PMID 37683097). The PubPeer API and search page refused automated access (HTTP 403), so PubPeer could not be checked. A general web search found no correction or discussion.
- Sources. PMC article PMC10619388; Europe PMC full-text XML and supplementary-files package for PMC10619388; Crossref record for 10.1002/hbm.26474; Europe PMC record PMID 37683097.
Suggested correction
- Re-run or re-extract the DAN mediation and report the indirect effect (a × b), its 95% CI, the direct effect c′ and the total effect c. Give the method used for the interval (for example the bootstrap type and number of resamples), the software, and whether the coefficients are unstandardized. Update the Results text, the Figure 7c(C) panel, and the Abstract and Discussion sentences that rest on this result.
- Make the labels in the Results text consistent with the path diagrams of Figures 3c(H) and 7c(C). The text currently calls the figures' c′ the "indirect effect", and calls the "bootstrap estimate" (DAN) or the total effect c (C-D) the "direct effect". Also correct the C-D panel's bootstrap estimate (2.241), which lies outside its own interval.
- Correct the Figure 7 caption's correlation signs, and the Discussion sentence calling the DAN–attention correlation negative, to match the Results (r = −0.266 with anhedonia, r = 0.419 with attention), or correct the Results if the caption is right.
- State the number of patients in each correlation and mediation analysis (the r/p pairs imply about 55 and 31). Reconcile Results paragraph 3 ("significantly higher in adolescents with MDD") with the Abstract and Discussion ("significantly weaker").
- If a valid interval for the DAN indirect effect includes zero, revise the title, the Abstract and the Discussion so that the mediation claim rests on the EEG result alone.