← Back to the plain-language case
Abstract reports SF2/SRSF1 decrease in astrocytes; the paper's data show it only in PNG and SPG
PLoS Genet (2023) · doi:10.1371/journal.pgen.1010973 · PMC10553832
Summary
The abstract says that after glial TDP-43 induction "SF2/SRSF1 levels were found to be decreased in both PNG and in astrocytes." The paper's own expression data, S8 Table, report a significant decrease only in perineurial glia (PNG; log2 fold change −1.31, p<0.0001) and subperineurial glia (SPG; −0.85, p<0.001). For astrocyte-like glia (ALG), the cell type the paper calls astrocytes, the table gives "n/a", and the Results say outright that TDP-43 induction in astrocytes "does not on its own cause a decrease in SF2/SRSF1 expression." So the abstract names the one cell type in which the body says there is no decrease and leaves out SPG, where there is one. The lifespan rescue by SF2/SRSF1 knockdown (Fig 5) comes from separate experiments and is not affected, but the abstract misstates the only specific transcriptomic result it names.
What the paper reports
Abstract:
Notably, SF2/SRSF1 levels were found to be decreased in both PNG and in astrocytes. We found that further knockdown of SF2/SRSF1 in either PNG or astrocytes lessens the detrimental effects of TDP-43 pathology on lifespan, but extends survival of the glial cells.
Results, section "Knockdown of SF2/SRSF1 in astrocytes or PNG ameliorates the toxicity of TDP-43", first paragraph:
Our differential expression analysis identified SF2/SRSF1 as being down regulated in response to TDP-43 expression in PNG (-1.31 log2 fold change, p<0.0001) and SPG (-0.85 log2 fold change, p < .001), but not in CG, ALG, or EG (S8 Table).
Same section, second paragraph:
The fact that SF2/SRSF1 levels are reduced in SPG and PNG, but not other glial cell types, is intriguing given that pan-glial knockdown of SF2/SRSF1 can ameliorate the lifespan effects of pan-glial TDP-43 pathology (Fig 5A) [55]. We observe a substantial impact on lifespan from pathological TDP-43 induction in PNG and ALG (Fig 1), but only see down regulation of SF2/SRSF1 in PNG (S8 Table).
And although TDP-43 induction in astrocytes does not on its own cause a decrease in SF2/SRSF1 expression, knock-down in astrocytes of SF2/SRSF1 by RNAi does ameliorate the effects on lifespan from astrocytic induction of TDP-43 pathology.
Introduction, last paragraph:
We observe that in response to TDP-43 pathology, SF2/SRSF1 is down-regulated in both the PNG and SPG specialized BBB glia.
Discussion, paragraph on the expression profiling:
Notably, the SF2/SRSF1 gene exhibits decreased expression in PNG and SPG, but not other glial cell types (S8 Table).
How the paper identifies astrocytes. Introduction:
the cortex glia (CG), astrocyte-like glia (ALG), and ensheathing glia (EG) provide many of the functional characteristics of mammalian astrocytes and microglia
The strain table (Table 2) lists "R86E01-Gal4 (ALG)". The Fig 5C genotype in the Methods is "Tubulin-Gal80 ts / UAS-SF2-IR; UAS-TDP-43/ R86E01-Gal4", and the Fig 5 legend labels that panel "ALGts + TDP-43 + SF2-IR". The Results describe the same experiment as "the PNG or Astrocyte Gal4 lines" and "TDP-43 induction in either PNG or ALG (Fig 5B and 5C)". In this paper "astrocytes" and ALG are the same cells.
S8 Table (supplementary file pgen.1010973.s011), legend:
SF2 expression was significantly reduced at day 2 post induction of TDP-43 in SPG and PNG day 2.
The table's body, paraphrased from the PDF (row label "SF2 expression (MRN)"; values per group, given here as control → +TDP-43, then log2 fold change and p):
- PNG: 899 → 363; −1.31; p<0.0001
- SPG: 1090 → 594; −0.85; p<0.001
- CG: 780 → 727; n/a; n/a
- ALG: 591 → 453; n/a; n/a
- EG: 780 → 669; n/a; n/a
The column headers give n = 3 libraries per group, except n = 2 for the CG and ALG controls. The table does not say whether the per-group values are means, and it does not define "n/a"; the Results' "but not in CG, ALG, or EG" supports reading "n/a" as not significant. The Methods say the analysis used DESeq2 with a Benjamini–Hochberg FDR threshold of p < 0.05.
What the paper's own numbers show
Method. I took the five cell types' per-group SF2/SRSF1 expression values (control and TDP-43) and the reported log2 fold changes and p values from S8 Table. For each cell type I computed the raw log2 ratio of the two group values, treating them as group-level summaries. This is not the DESeq2 estimate, which is model-based and works on per-library counts, so it can only check that the table's group values and its reported fold changes agree; it is not a test. I then listed which cell types the Abstract, Introduction, Results, Discussion and S8 Table each say are decreased, and compared the lists. Every number below is printed by recompute.py.txt.
| Quantity | Location | Reported | Recomputed from the paper's numbers |
|---|---|---|---|
| PNG, SF2/SRSF1 change | S8 Table; Results | 899 → 363 MRN; log2FC −1.31, p<0.0001 | log2(363/899) = −1.308; group values fall 59.6% (2^−1.31 = 0.403, a 59.7% fall) |
| SPG, SF2/SRSF1 change | S8 Table; Results | 1090 → 594 MRN; log2FC −0.85, p<0.001 | log2(594/1090) = −0.876; group values fall 45.5% (2^−0.85 = 0.555, a 44.5% fall). The 0.026 gap from −0.85 is consistent with model-based estimation |
| ALG (astrocyte-like glia), SF2/SRSF1 change | S8 Table; Results | 591 → 453 MRN; log2FC n/a, p n/a | log2(453/591) = −0.384 (−23.4%); not reported as significant ("n/a", read with the Results' "but not in ... ALG") |
| CG, SF2/SRSF1 change | S8 Table | 780 → 727 MRN; n/a | log2(727/780) = −0.102 (−6.8%) |
| EG, SF2/SRSF1 change | S8 Table | 780 → 669 MRN; n/a | log2(669/780) = −0.221 (−14.2%) |
| Cell types with a significant decrease | S8 Table and legend | PNG, SPG | PNG, SPG |
| Cell types with a decrease, per the text | Introduction; Results; Discussion | PNG and SPG (Results and Discussion add: not CG, ALG or EG) | agrees with S8 Table |
| Cell types with a decrease, per the abstract | Abstract | PNG and astrocytes (ALG) | ALG is not significant in S8 Table; SPG, which is significant, is not named |
Figure
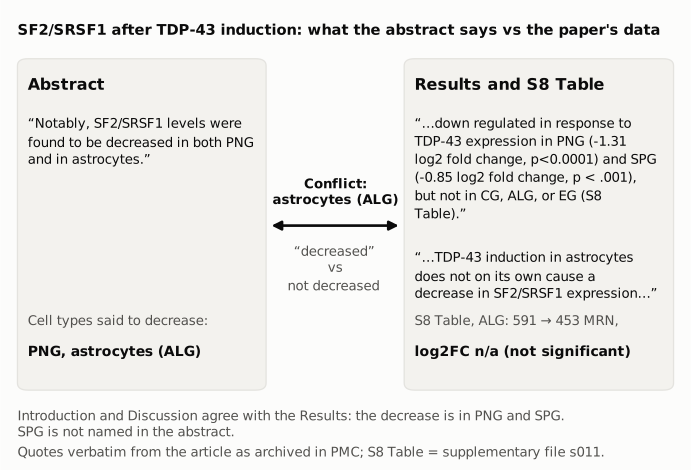
Figure 1. The abstract sentence (left) and the Results sentences and S8 Table entry for the same cell type (right), quoted verbatim from the article as archived in PMC. The abstract names astrocytes, which the paper identifies as ALG, as a cell type in which SF2/SRSF1 decreased. The Results and S8 Table report no significant change in ALG (591 to 453 MRN, log2 fold change "n/a"), and the Results state that TDP-43 induction in astrocytes does not on its own decrease SF2/SRSF1. The Introduction and Discussion give the decrease as PNG and SPG.
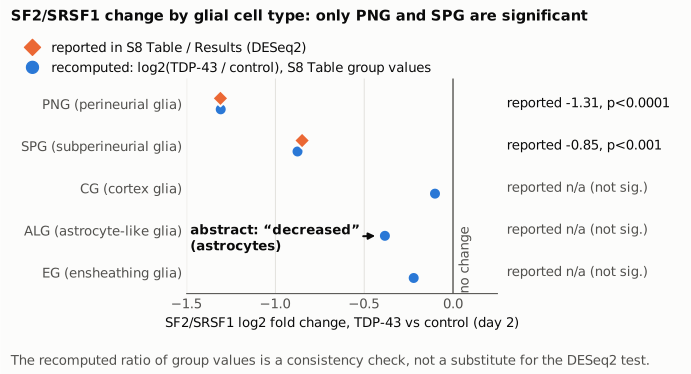
Figure 2. SF2/SRSF1 log2 fold change after TDP-43 induction (day 2) in each glial cell type. Orange diamonds are the DESeq2 estimates reported in S8 Table and the Results, which exist only for PNG and SPG; the other three cell types are given as "n/a", which the Results describe as not down-regulated. Blue circles are the raw log2 ratio of the S8 Table group values, computed by recompute.py.txt as a consistency check. The vertical line marks no change. The ALG point, which the abstract describes as decreased, is a non-significant −0.38.
Why it matters
The abstract is what most readers and indexing services see, and this sentence is the only specific transcriptomic result the abstract names (it otherwise says only that the authors "identified numerous glial cell-type specific transcriptional changes"). As written, it tells readers that TDP-43 lowers SF2/SRSF1 in the two cell types with the strongest lifespan effects (PNG and astrocytes), and the next sentence's "further knockdown" builds on that. The body's account is different, and the Results call it "intriguing": the decrease is confined to the two blood-brain-barrier glia (PNG and SPG), it is absent in astrocytes, and knockdown in astrocytes still extends lifespan. The Results draw exactly this contrast ("although TDP-43 induction in astrocytes does not on its own cause a decrease..."). A reader who relies on the abstract is told there is a decrease in astrocytes, where the paper reports no significant change, and does not learn about the SPG decrease.
What is not affected: the lifespan extension from SF2/SRSF1 knockdown in pan-glial, PNG and ALG TDP-43 models (Fig 5A–C, log-rank tests), the delayed glial loss with knockdown (Fig 5D–E), and the reaper ablation result in PNG. These are separate experiments and do not depend on the expression data. The title's claim stands.
Explanations considered
"Astrocytes" in the abstract means a different cell type, such as SPG. This does not fit. The paper uses "astrocytes" for ALG throughout: the Results section title is "Knockdown of SF2/SRSF1 in astrocytes or PNG", the experiment uses "the PNG or Astrocyte Gal4 lines" and reports the outcome as "PNG or ALG (Fig 5B and 5C)", and the Fig 5C driver is R86E01-Gal4, listed in Table 2 as the ALG line. SPG is described as a blood-brain-barrier glial type, alongside PNG, and is never called astrocytes.
A different time point or dataset shows an ALG decrease. None found. S8 Table covers one time point (day 2 after induction), the same as the RNA-seq design described in the Results, and the text cites no other SF2/SRSF1 expression data.
The abstract describes a non-significant trend. The ALG group values do fall (raw log2 ratio −0.38, from n = 2 control libraries), but the paper reports this as n/a, and its own Results rule out this reading by saying ALG is not down-regulated and that astrocytic TDP-43 "does not on its own cause a decrease." The abstract's wording ("were found to be decreased", the same wording used for PNG) presents it as a finding.
Text conversion or archiving error. Not supported. The PLOS article page, the Europe PMC full text and the PMC archive have the same abstract sentence, and the S8 Table PDF from the publisher has the values above.
The small SPG discrepancy (−0.876 vs −0.85). A ratio of group values need not equal a DESeq2 model estimate. This gap is small and does not bear on the finding; the PNG value agrees to within 0.002.
A narrower reading of one Results sentence. "...only see down regulation of SF2/SRSF1 in PNG" agrees with the table: it compares only PNG and ALG, the two cell types with the strongest lifespan effects, and SPG is not part of that comparison.
Status
As of 2026-10-23:
- Version of record. The PLOS Genetics article page (the current "Version 2"; a "Version 1 Uncorrected Proof" is also linked) has the same abstract and Results wording as the PMC archive. The Europe PMC full text has the identical abstract sentence.
- Supplements. S8 Table (doi:10.1371/journal.pgen.1010973.s011), a one-page PDF, was downloaded from the publisher and its text extracted; the values match those above. It is the table the text cites for this result. The other supplementary items (S1–S3 Figs, S1–S7 Tables) were not needed for this check.
- Corrections. Crossref lists only a publisher "new version" relation dated 2023-10-05, ten days after online publication on 2023-09-25. This fits the replacement of the Version 1 Uncorrected Proof by Version 2. It has no correction DOI. PMC and Europe PMC list no correction, erratum, expression of concern or retraction, and Europe PMC's record links only the bioRxiv preprint (doi:10.1101/2023.05.04.539439). The PLOS comments page shows no reader comments.
- PubPeer. Web searches found no PubPeer thread or other public discussion of this point. PubPeer itself could not be searched directly (it returned a human-verification page), so a thread there cannot be ruled out.
Sources: the article as archived in PMC (PMC10553832); journals.plos.org/plosgenetics/article?id=10.1371/journal.pgen.1010973 and its supplementary file s011; Crossref and Europe PMC records for doi:10.1371/journal.pgen.1010973.
Suggested correction
In the abstract, replace
Notably, SF2/SRSF1 levels were found to be decreased in both PNG and in astrocytes. We found that further knockdown of SF2/SRSF1 in either PNG or astrocytes lessens...
with wording that matches the Results and S8 Table, for example:
Notably, SF2/SRSF1 levels were found to be decreased in PNG and SPG, but not in astrocytes. We found that knockdown of SF2/SRSF1 in either PNG or astrocytes lessens...
The word "further" would then apply only to PNG. If the authors prefer to keep the sentence about the two cell types tested in Fig 5, it could instead say that SF2/SRSF1 was decreased in PNG but not in astrocytes.