← Back to the plain-language case
Abstract reports 389 animals; the Methods list 116, and 389 sums per-context subject counts
eLife (2023) · doi:10.7554/eLife.87008 · PMC10547472
Summary
The abstract says facial behavior was coded "in 389 animals". The Methods list the study subjects by species and sex, and they add up to 116 adults (32 rhesus, 46 Barbary, 38 crested macaques). Table 2 agrees with the Methods: no per-context subject count is larger than the Methods headcount for its species. The figure 389 is exactly the sum of Table 2's "N subjects" column over all twelve species-by-context rows, so it counts each animal once for every context it was coded in. The study's analyses do not use this number and its conclusions are unaffected, but anyone who reads only the abstract will take the sample to be 3.35 times as large as it is.
What the paper reports
Abstract:
We coded facial behavior in >3000 social interactions across three social contexts (aggressive, submissive, affiliative) in 389 animals, using the Facial Action Coding System for macaques (MaqFACS).
Methods, "Study subjects and data collection", first paragraph:
Behavioral data and video recordings were collected on one adult male and 31 adult female rhesus macaques (M. mulatta), on 18 adult male and 28 adult female Barbary macaques (M. sylvanus), and 17 adult male and 21 adult female crested macaques (M. nigra).
Methods, "Facial behavior and social context coding":
We coded facial behavior of adult individuals but included their interactions with any other group member regardless of age or sex.
Table 2 shows the number of social interactions per species and context from which FACS codes were made.
Table 2, "Total number of social interactions per species and social context that were MaqFACS coded":
Species Context N interactions N subjects Duration (s) Rhesus Affiliative 193 29 1197 Rhesus Aggressive 413 32 2050 Rhesus Submissive 318 31 1262 Rhesus Unclear 121 30 802 Barbary Affiliative 683 43 4897 Barbary Aggressive 585 44 2128 Barbary Submissive 529 34 1890 Barbary Unclear 603 45 3500 Crested Affiliative 241 35 1918 Crested Aggressive 62 23 284 Crested Submissive 25 18 115 Crested Unclear 107 25 684
Discussion, on the comparison that limits inference:
Finally, effectively, our comparison is limited to three species which is a small sample.
What the paper's own numbers show
Method. I added the Methods counts by species and sex to get the number of distinct adults. For each species I summed the four Table 2 "N subjects" cells and found the largest of them. I then compared the sums with the abstract's 389, and the largest cell with the Methods headcount. As a separate check I summed the Table 2 interaction counts against the abstract's ">3000". Last, I counted animals in the authors' public data file (the file the paper's data availability statement points to): distinct animals per species, and the number of contexts each animal was coded in. Every number below is printed by recompute.py.txt. The data-file rows need the file itself: run python recompute.py.txt --data <path or URL>, where the URL is maqfacs.txt at the root of the GitHub repository the paper cites (Methods, "Specificity bias correction"), in raw form https://raw.githubusercontent.com/<owner>/macaque-facial-complexity/main/maqfacs.txt with <owner> taken from that citation. Its sha256 is printed and quoted under Status.
| Quantity | Location | Reported | Recomputed from the paper's numbers |
|---|---|---|---|
| Animals in the study | Abstract | 389 animals | 116 distinct adults (Methods) |
| Rhesus adults | Methods | 1 male + 31 female | 32 |
| Barbary adults | Methods | 18 male + 28 female | 46 |
| Crested adults | Methods | 17 male + 21 female | 38 |
| Total distinct adults | Methods | not stated | 32 + 46 + 38 = 116 |
| Rhesus, sum of N subjects over four contexts | Table 2 | 29, 32, 31, 30 | 122 (3.81 × the 32 adults) |
| Barbary, sum of N subjects over four contexts | Table 2 | 43, 44, 34, 45 | 166 (3.61 × the 46 adults) |
| Crested, sum of N subjects over four contexts | Table 2 | 35, 23, 18, 25 | 101 (2.66 × the 38 adults) |
| Sum of all 12 N-subjects cells | Table 2 | — | 122 + 166 + 101 = 389, identical to the abstract |
| Same sum without the Unclear rows | Table 2 | — | 289, so 389 is not a three-context total |
| Largest per-context N subjects, by species | Table 2 | 32 / 45 / 35 | at most the Methods headcount (32 / 46 / 38), as it must be |
| Abstract count relative to headcount | Abstract vs Methods | 389 | 389 / 116 = 3.35; 273 more animals than were studied |
| Interactions, three named contexts | Abstract vs Table 2 | >3000 | 924 + 1797 + 328 = 3049 (3880 with Unclear); consistent |
| Distinct animals in the authors' data file | Data file maqfacs.txt |
— | 32 rhesus, 46 Barbary, 40 crested = 118. Crested: 17 male, 22 female, 1 with no sex recorded (Methods: 17 male, 21 female). Rhesus and Barbary match the Methods by sex |
| Per-context distinct subjects in the data file | Data file | — | Reproduces all 12 Table 2 N-subjects cells and durations (to 0.5 s) once the file's "agonistic" label is merged into "unclear"; they sum to 389 |
| Contexts per animal in the data file | Data file | — | Rhesus: 27 animals in 4 contexts, 4 in 3, 1 in 2. Barbary: 29, 16, 1. Crested: 10 in 4, 13 in 3, 5 in 2, 12 in 1. Sum over animals of contexts = 389 |
The arithmetic leaves one reading. The abstract's 389 is the total of the "N subjects" column, a column that counts each animal once per context. Taken as a headcount, the paper's own Methods and Table 2 give 116 adults (118 animals in the published data file).
Figure
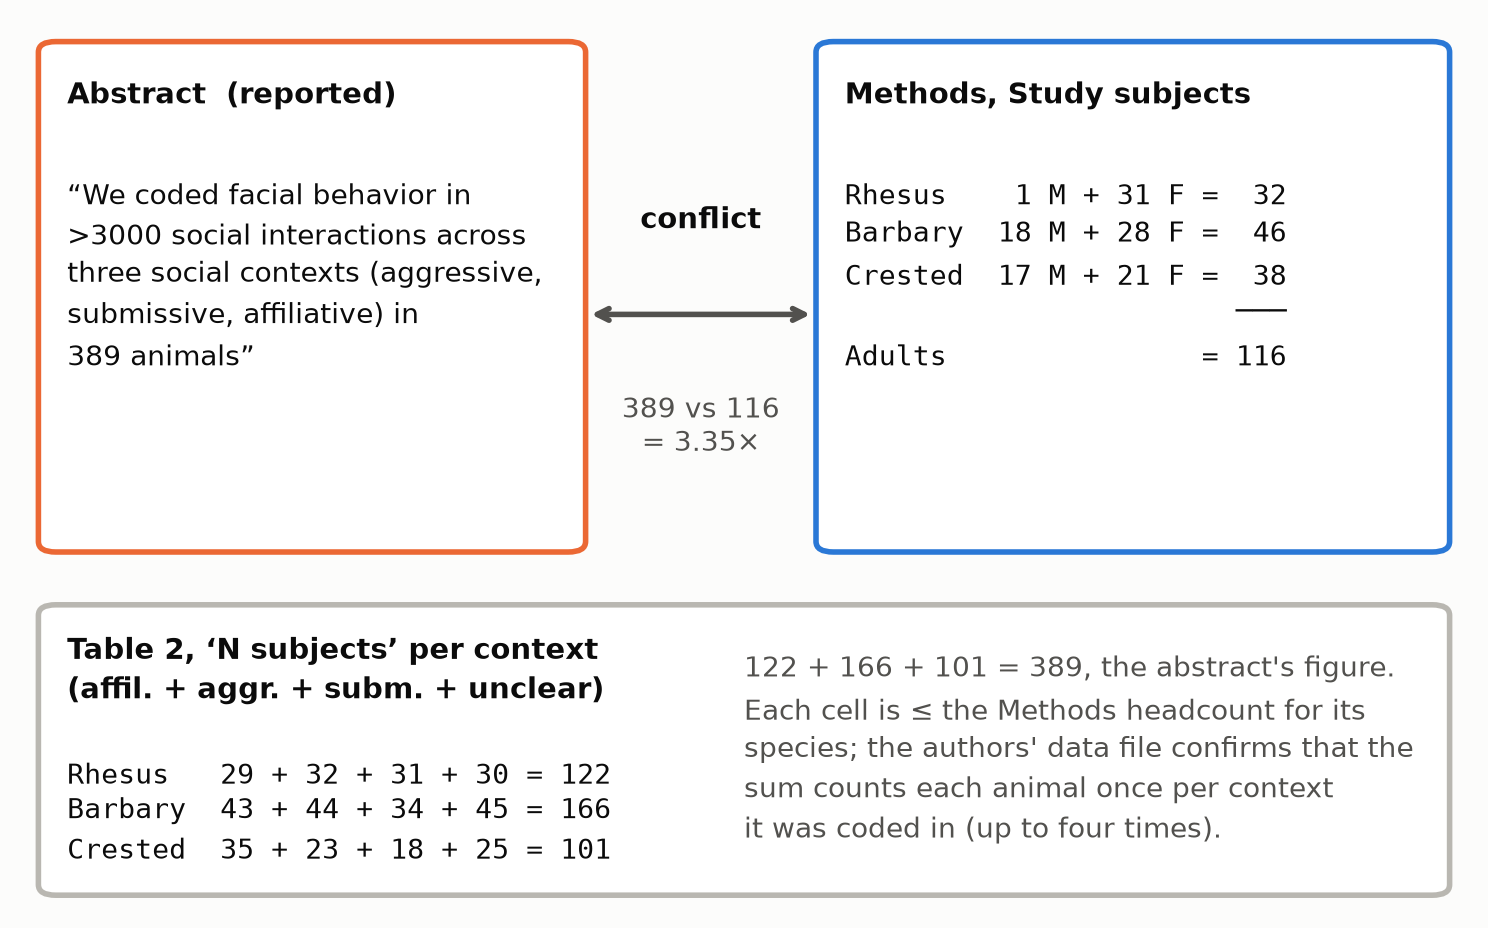
Figure 1. On the left is the abstract's sentence giving the sample as 389 animals (orange: the value the paper reports). On the right is the Methods list of adults by species and sex, which sums to 116 (blue: recomputed from the paper's own counts). The lower panel gives Table 2's four per-context "N subjects" values for each species. Each value is no larger than the Methods headcount for its species, which is consistent with each one counting distinct animals, and together they add up to 122 + 166 + 101 = 389. The authors' data file settles the reading: it reproduces all 12 cells, and the number of contexts per animal sums to 389 over 118 animals. The abstract's figure is therefore the number of subject-context pairs, not the number of animals. All values are taken from the paper or printed by recompute.py.txt.
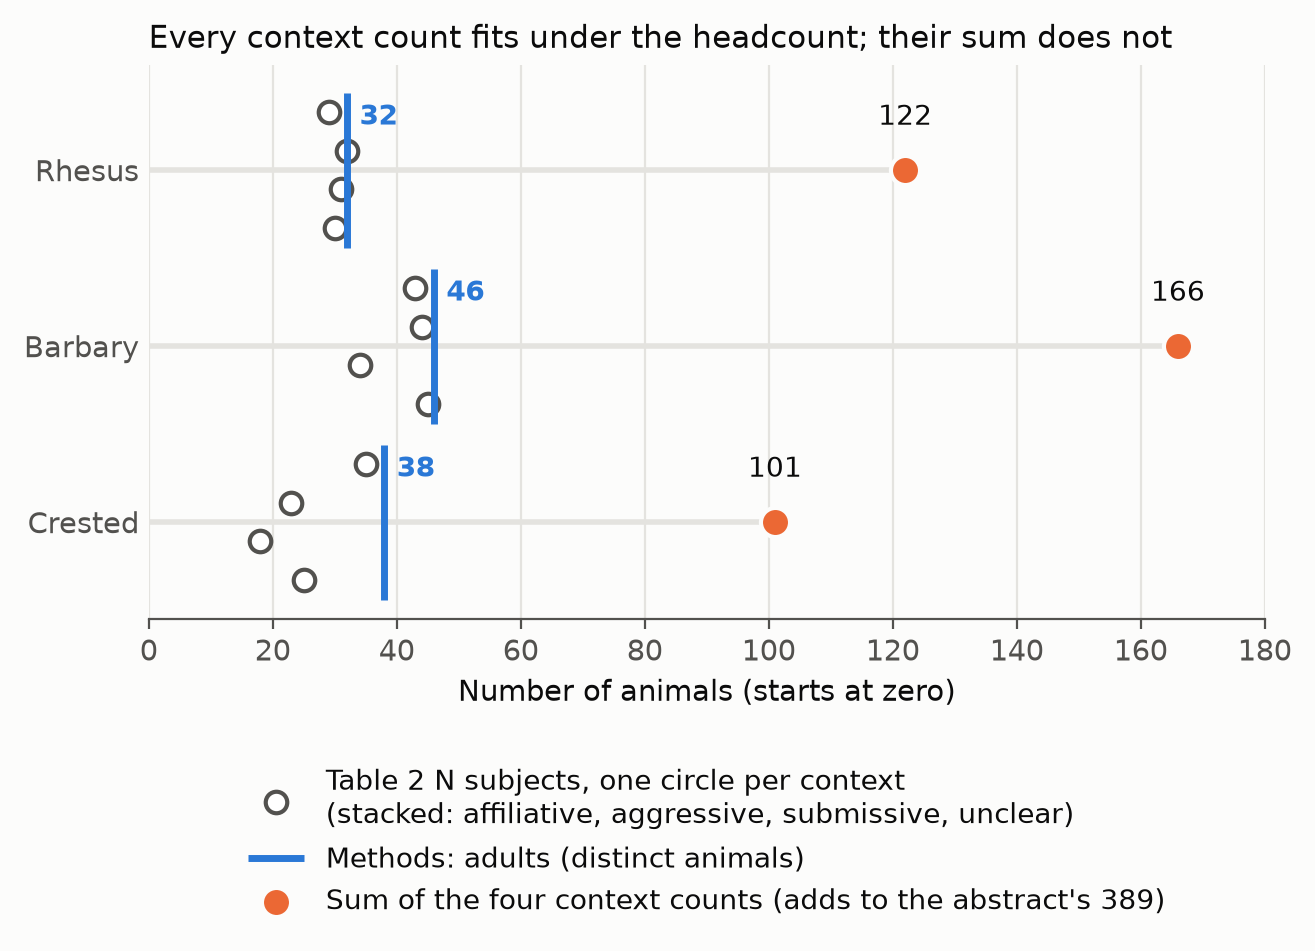
Figure 2. For each species, the open circles are the four Table 2 per-context subject counts, stacked vertically (affiliative, aggressive, submissive, unclear, top to bottom) so that close values such as 29 to 32 do not hide one another. The blue vertical line is the Methods headcount (32, 46, 38) and the orange circle is the sum of the four context counts (122, 166, 101; together 389). Every context count lies at or below the headcount, which is consistent with each one counting distinct animals (the data-file check confirms it). Their sum is 2.7 to 3.8 times the headcount (3.81 rhesus, 3.61 Barbary, 2.66 crested) because most animals appear in more than one context. The axis starts at zero.
Why it matters
The error is in the abstract, the part of a paper that is read, indexed and copied most widely. A reader, reviewer or meta-analyst who takes the sample size from the abstract or from a database built from it will record N = 389. The correct figure is about 116 (118 in the published data file), so the study would look 3.35 times as large as it is. That matters most when studies are weighed or compared by number of individuals, and in particular for the rhesus sample: 32 animals from one breeding group, 31 of them female, a limitation the Methods acknowledge.
The inferential results are not affected. Entropy, context specificity and the random-forest classifier are computed from 500 ms time blocks within interactions, and the species comparison rests on three species, as the Discussion states. The headcount enters none of these calculations, so every reported estimate and its direction stand. The abstract's other count, ">3000 social interactions", is consistent with Table 2 (3049 in the three named contexts).
Explanations considered
- Interaction partners counted as animals. The Methods say partners could be "any other group member regardless of age or sex", so more than 116 individuals may appear in the videos. But the abstract says facial behavior was coded "in 389 animals", and the Methods say facial behavior was coded only for adults. The paper gives no group sizes or partner counts that add up to 389, so this does not account for the number.
- Another population or time point. Each species has one sample in the Methods: one rhesus breeding group, one Barbary group and two wild crested groups. Table 2's per-context subject counts never exceed the Methods headcounts. Nothing in the paper describes a larger sample.
- A three-context total. The abstract mentions three contexts. Without the Unclear rows the N-subjects sum is 289, not 389, so the figure is not a three-context total either. Only the full twelve-cell sum matches.
- A text-conversion or version artifact. The values are plain integers, and the PMC archive, Europe PMC, the eLife version of record and all five bioRxiv preprint versions carry the same abstract sentence and the same Methods counts. The authors' data file reproduces every Table 2 subject count and duration. So this is not an artifact of conversion or of one version.
- A small difference in the crested count. The data file has 40 distinct crested animals (17 male, 22 female, 1 with no sex recorded) and the Methods list 38 (17 male + 21 female). It does not matter here: on any version the headcount is 116 to 118, not 389.
None of these explains the number. Adding up the per-context subject counts reproduces it exactly.
Status
As of 2026-10-23:
- Version of record. I checked the eLife version of record (published 2023-10-03,
status: vorin the eLife article API). Its abstract has the same sentence ("… in 389 animals …"), and its Methods counts and Table 2 match the PMC archive. Europe PMC's full text and all five bioRxiv preprint versions (2022-12-07 to 2023-08-16) also say "389 animals". - Supplements. Supplementary file 1 lists the Action Units and Action Descriptors, and the other file is the MDAR reporting checklist. Neither gives subject counts. The public data file
maqfacs.txt(sha2566e68e6e1…a5f, 41 454 rows of 500 ms blocks) gives 118 distinct animals and reproduces Table 2. - Corrections. Crossref update metadata, PMC and Europe PMC list no correction, erratum, expression of concern or retraction (
src/known.py). - PubPeer. A web search found no PubPeer thread for the DOI or the title. PubPeer's own search refused automated access (HTTP 403, human verification required), so I could not query it directly.
- Sources. PMC10547472 (text and Table 2); api.elifesciences.org/articles/87008; Europe PMC full-text XML; bioRxiv doi:10.1101/2022.12.07.519469; Crossref.
Suggested correction
Abstract, change "in 389 animals" to "in 116 adult animals" (or the authors' deduplicated count, 118 if the data file's 40 crested individuals are the correct figure). If a per-context total is wanted, it could be stated as such, for example: "116 adults (389 subject-context combinations)". Reconciling the crested count, 38 in the Methods and 40 in the data file, would make the Methods and the data file agree.