← Back to the plain-language case
Abstract's adjusted hazard ratio 1.30 lies outside its printed 95% CI; Table 2 gives 0.66–2.56
Stroke (2023) · doi:10.1161/STROKEAHA.123.043336 · PMC10519293
Summary
The abstract reports the multivariable hazard ratio for the primary outcome (any stroke or TIA, patients with new DWI lesions vs without) as "1.30 [95% CI, 0.10–1.02]". A point estimate cannot lie outside its own confidence interval, and no rounding closes the gap: the interval is centred on 0.32 on the log scale. The paper's own Table 2 gives the same estimate as 1.30 (0.66–2.56), P=0.454, and that interval is internally consistent: it is centred on 1.30 and implies P≈0.45. The error is confined to the abstract's interval. The point estimate, its non-significance and the paper's conclusion are unchanged, but the abstract's headline adjusted result is impossible as printed and, read at face value, points in the protective direction.
What the paper reports
Abstract, Results:
Uni- and multivariable regression analyses did not show significant differences (hazard ratio, 1.50 [95% CI, 0.76–2.94] and hazard ratio, 1.30 [95% CI, 0.10–1.02], respectively).
Abstract, Methods (definition of the outcome these hazard ratios refer to):
The primary composite clinical outcome was the time to any stroke or transient ischemic attack during follow-up.
Methods, Statistical Analysis:
Cox proportional hazard regression models were used to calculate the hazard ratio (HR) with 95% CI for the association between DWI presence and cerebrovascular events during follow-up.
Models were adjusted for the demographic or clinical variables that showed an association of P<0.20 with the determinant (DWI presence) as well as with the outcome of interest (Table S1).
Results, first paragraph:
The binary uni- and multivariable cox regression analyses revealed no significant difference in recurrent cerebrovascular events between DWI+ patients and DWI- patients (Table 2).
Table 2, "HRs of Outcome Events During Follow-Up Depending on New Postoperative DWI Lesions", first column ("Stroke and TIA in any territory"), block "DWI+ (n=51) vs DWI– (n=111)". Table 2 is typeset as an image in the archived article (str-54-2562-g002.jpg), so these cells were read from that image rather than from a text conversion:
Unadjusted | 1.50 (0.76–2.94), P=0.245
Adjusted | 1.30 (0.66–2.56), P=0.454*
*Corrected for age and systolic blood pressure.
Abstract, Conclusions:
Based on our outcome analysis within the ICSS magnetic resonance imaging substudy, DWI lesions following carotid revascularization did not seem to have a relationship with long-term stroke risk.
What the paper's own numbers show
Method. Cox model confidence intervals are Wald intervals on the log-hazard scale, so a correctly printed 95% CI is symmetric around ln(HR). From each printed HR and CI I computed: whether the HR lies inside the interval; the geometric centre √(lower × upper), which should equal the HR up to rounding; the log-asymmetry [ln(upper) − ln(HR)] − [ln(HR) − ln(lower)], which should be about 0; the standard error (ln upper − ln lower)/(2 × 1.96); and the two-sided P implied by ln(HR)/SE, for comparison with the printed P. I applied the same checks to every DWI+ vs DWI− cell of Table 2 and to the Fine-Gray sensitivity analysis in Supplemental Table S2, so that the abstract figure can be judged against the paper's other estimates. Every number below is printed by recompute.py.txt.
| Quantity | Location | Reported | Recomputed from the paper's numbers |
|---|---|---|---|
| Multivariable HR, any stroke/TIA | Abstract, Results | 1.30 [95% CI 0.10–1.02] | 1.30 is outside the interval; geometric centre 0.32; log-asymmetry −2.81 (expected ≈ 0) |
| Rounding margin | derived | — | smallest HR that rounds to 1.30 is 1.295; largest upper limit that rounds to 1.02 is 1.025; gap 0.270 |
| Adjusted HR, any stroke/TIA (age, systolic BP) | Table 2 | 1.30 (0.66–2.56), P=0.454 | centre 1.30; log-asymmetry 0.00; SE 0.346; P=0.448 |
| 95% CI implied by HR 1.30 with the Table 2 SE | derived | 0.10–1.02 (abstract) | 0.66–2.56, identical to Table 2 |
| Univariable HR, any stroke/TIA | Abstract; Table 2 | 1.50 (0.76–2.94), P=0.245 | centre 1.49; log-asymmetry −0.01; SE 0.345; P=0.240 |
| Log-width of the CI | Abstract vs Table 2 | 0.10–1.02 vs 0.76–2.94 and 0.66–2.56 | 2.32 vs 1.35 and 1.36: the abstract interval is 1.72 times as wide as the univariable one |
| Unadjusted / adjusted, ipsilateral stroke/TIA | Table 2 | 1.91 (0.81–4.49), P=0.138; 1.25 (0.52–2.98), P=0.619 | centres 1.91 and 1.24; P=0.139 and 0.616 |
| Unadjusted, stroke in any territory | Table 2 | 0.69 (0.26–1.84), P=0.456 | centre 0.69; P=0.457 |
| Unadjusted / adjusted, ipsilateral stroke | Table 2 | 0.88 (0.24–3.25), P=0.845; 0.78 (0.21–2.93), P=0.713 | centres 0.88 and 0.78; P=0.848 and 0.712 |
| Adjusted, stroke in any territory (side observation) | Table 2 | 0.70 (0.29–1.51), P=0.493 | centre 0.66; log-asymmetry −0.11; P=0.397 from the CI. A smaller inconsistency, separate from this report |
| Fine-Gray unadjusted / adjusted, any stroke/TIA | Supplemental Table S2 | 1.35 (0.68–2.66); 1.16 (0.57–2.36) | centres 1.34 and 1.16; both consistent; neither is 0.10–1.02 |
Apart from the abstract's multivariable interval, every estimate of this outcome in the paper passes the checks to within rounding. Its adjusted interval in Table 2 has almost exactly the univariable width (1.36 vs 1.35 on the log scale), as expected when adjusting for two covariates in a cohort of 162.
Figure
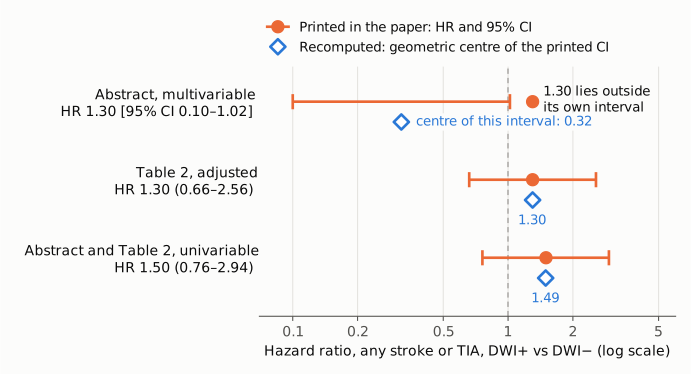
Hazard ratios for the primary outcome (any stroke or TIA, DWI+ vs DWI−) on one log-scaled axis. Orange: the HR (dot) and 95% CI (bar) as printed in the paper. Blue diamonds: the geometric centre of each printed interval, recomputed in recompute.py.txt. For a Cox model's Wald interval it should coincide with the HR. The dashed line marks HR = 1 (no difference). The abstract's multivariable row is the only one where the centre (0.32) and the printed HR (1.30) disagree, and its HR sits to the right of the upper limit. The Table 2 adjusted row and the univariable row are self-consistent. The abstract's interval is also wider, not narrower, than the univariable one.
Why it matters
The abstract's multivariable hazard ratio is the adjusted result for the primary outcome, and most readers and indexing services see only the abstract. As printed, the pair is impossible. Taken at face value, the interval 0.10–1.02 describes an estimate near 0.32 (a protective association) whose upper limit only just reaches 1. The study's actual adjusted estimate is 1.30 (0.66–2.56): imprecise, not significant, and leaning towards a higher hazard in DWI+ patients. The upper limit of the correct interval, about a 2.6-fold hazard, also bears on how the conclusion "did not seem to have a relationship with long-term stroke risk" should be read: the data do not exclude a clinically relevant increase. That caveat applies whichever interval is printed, but the misprinted one hides it.
Neither the direction of the main conclusion nor its significance depends on the error. Both the printed and the correct intervals include 1, the point estimate is the same, and the correct value is printed in Table 2 of the same article. A reader who checks Table 2 can recover the right value. A reader of the abstract alone, or of a database record built from it, cannot.
Explanations considered
- Rounding. Not enough. Rounding moves each number by at most 0.005, and the HR exceeds the upper limit by at least 0.270 (
recompute.py.txt, section 2). - A different kind of interval (profile likelihood, bootstrap). Not consistent with the paper. The Methods describe Cox models with 95% CIs, and the paper applies bootstrapping only to the DWI-count analyses (Table 2, "Bootstrap" row). Profile-likelihood and bootstrap intervals for a maximum-likelihood estimate would still be expected to contain the estimate. An interval that lies entirely on one side of it (log-asymmetry −2.81) is not what either method produces. The Table 2 interval for the same model is a symmetric Wald interval.
- Reversed reference group (DWI− vs DWI+). Does not reproduce the numbers. Inverting the Table 2 adjusted result gives 0.77 (0.39–1.52), and inverting the univariable result gives 0.67 (0.34–1.32). Neither is 0.10–1.02.
- Limits reported on the log scale. No. The Table 2 adjusted limits on the log scale are −0.42 and 0.94.
- A different model (competing-risk sensitivity analysis). No. Supplemental Table S2 gives Fine-Gray estimates of 1.35 (0.68–2.66) unadjusted and 1.16 (0.57–2.36) adjusted for this outcome. Both are consistent, and neither matches.
- A different cell of the paper. I found no 0.10–1.02 pair in Table 2 or in Supplemental Tables S1–S3. Table S1 contains the upper limit 1.02 in other rows, for example "0.42 (0.18, 1.02)" for ipsilateral stenosis, but no matching pair. The source of the abstract's interval cannot be determined from the paper.
- A text-conversion or archiving artifact. Ruled out. The same text appears in the PMC article page and in the Europe PMC full-text XML, both of which come from the publisher's own JATS deposit, and the en-dash formatting is the same as in the neighbouring, correct interval.
What remains is that the abstract's confidence limits were transcribed incorrectly. The paper does not show how this happened.
Status
As of 2026-10-24:
- Version of record. The abstract text was checked in the PMC article page (pmc.ncbi.nlm.nih.gov/articles/PMC10519293) and in the Europe PMC full-text XML. Both read "hazard ratio, 1.30 [95% CI, 0.10–1.02]". The publisher's pages at ahajournals.org (HTML and PDF) returned HTTP 403, so the PMC deposit of the publisher's XML stands in for the version of record. Table 2 was read from the publisher's typeset image (str-54-2562-g002.jpg) downloaded from the PMC CDN.
- Supplements. The supplementary files were downloaded through the Europe PMC supplementaryFiles endpoint: the STROBE checklist (str-54-2562-s001.pdf) and the Supplemental Material (str-54-2562-s002.pdf, Tables S1–S3 and Figures S1–S2). Table S2 gives consistent Fine-Gray estimates (above). Nothing in the supplement contains 0.10–1.02.
- Corrections and retractions. None found. The Crossref record has no update-to or updated-by entries and an empty relation field. Crossref and the PMC and Europe PMC notice checks (
src/known.py) returned nothing. The PMC article page shows no notice. A web search for the title with "correction", "erratum" and "PubPeer" returned only the article and news coverage of it. Europe PMC search returned HTTP 503 ("Search service is temporarily unavailable") on every attempt. - PubPeer. The search page returned HTTP 403, so PubPeer comments could not be checked directly.
- Sources: PMC article; Crossref record; Europe PMC supplementary files; DOI.
Suggested correction
In the Abstract, Results, replace "hazard ratio, 1.30 [95% CI, 0.10–1.02]" with "hazard ratio, 1.30 [95% CI, 0.66–2.56]", the value given for the same adjusted model in Table 2 (adjusted for age and systolic blood pressure; P=0.454). The authors may also wish to check the Table 2 cell for adjusted stroke in any territory, "0.70 (0.29–1.51), P=0.493". Its interval is centred on 0.66, and the P value it implies (0.40) differs from the one printed, which suggests that one of those numbers may also need correcting.