← Back to the plain-language case
Reported correlations of |r| = 0.26–0.37 cannot reach P < 0.01 with 27 participants
Cereb Cortex (2023) · doi:10.1093/cercor/bhad233 · PMC10431748
Summary
The paper reports eight Spearman correlations between the tone-deviant mismatch negativity (MMN) and cognitive scores in adults with Down syndrome, with |r| between 0.26 and 0.37, and labels them significant at P < 0.01, P < 0.001 or P < 0.0001. The stated analysis sample is 27 participants, which the paper's Supplementary Table 1 confirms. At n = 27 these coefficients give two-sided P values of 0.057 to 0.19, so none meets the paper's own alpha of 0.01, and none reaches 0.05. These eight correlations are the only evidence for the title claim that the MMN is "an index of cognitive abilities", and for the associations with memory, verbal ability and attention stated in the Abstract and Conclusions.
What the paper reports
Results, "Spearman’s rank correlation coefficients" (the whole paragraph):
The amplitude of the Tone deviant MMN (i.e. the difference between Tone deviant and Frequent sounds) significantly negatively correlated with the number of PAL stages completed (r = -0.26, P < 0.01). Finally, Tone deviant MMN latency significantly negatively correlated with the KBIT-2 composite IQ score (r = -0.37, P < 0.0001), KBIT-2 verbal IQ score (r = -0.31, P < 0.0001), KBIT-2 verbal raw score (r = -0.35, P < 0.0001), KBIT-2 non verbal IQ score (r = -0.27, P < 0.001), PAL first trial memory score (r = -0.35, P < 0.0001), SRT total score (r = -0.30, P < 0.01), and significantly positively correlated with the SRT standard deviation score (r = 0.30, P < 0.001), as shown in Fig. 5.
Results, "Sample description":
The final sample for analyses consisted of 27 individuals (M = 32.4 years, SD = 11.5; age range = 17–51; 14 females), of which 12 had mild intellectual disability, 14 moderate, and 1 severe.
Materials and methods, "Statistical analyses":
Correlations between mean amplitude and latency of both Pitch and Tone deviant MMN and neuropsychological scores were conducted using Spearman’s rank correlation coefficients. This exploratory approach enabled the examination of potential associations between the auditory response and cognitive function without a priori hypotheses. To minimize type I error likelihood arising from multiple correlations, the alpha significance level was set to P < 0.01.
Fig. 5 caption (beginning):
Spearman’s correlation between MMN parameters and cognitive task scores (P < 0.01).
Fig. 5 itself is a triangular heat map in which only some cells carry a coefficient. The MMN rows show the eight coefficients above and one more, MMN latency vs K-BIT 2 non-verbal raw, −0.14. Among the cognitive-cognitive cells, the smallest shown include −0.11 (K-BIT 2 verbal IQ vs SRT mean) and −0.15 (K-BIT 2 composite IQ vs SRT mean). I read these values from the figure image (bhad233f5.jpg).
Abstract:
Reduced MMN amplitude was associated with lower memory scores, while longer MMN latencies were associated with poorer memory, verbal abilities, and attention. Therefore, the MMN may represent a valuable index of cognitive abilities in DS.
Conclusions:
The prolonged MMN latencies appear to be associated with memory, verbal IQ, and general IQ, suggesting that delays in speech-sound processing may underlie a more global detrimental effect on cognition in this population that precedes the development of AD; though this might be further worsened by AD pathology.
Discussion, "Strengths, limitations, and future directions":
Additionally, whilst the correlational analyses provide insight into the relationship between MMN characteristics and cognitive function, it should be noted that they were conducted in an exploratory manner without correction for multiple comparisons, which may increase the risk of Type I errors.
What the paper's own numbers show
Method. For a two-sided test of a Spearman coefficient r with n observations, the usual approximation is t = r·√((n − 2)/(1 − r²)) on n − 2 degrees of freedom. I applied it at the stated n = 27 (df = 25). Because the t approximation can be imprecise for rank correlations in small samples, I also computed each P value from a Monte Carlo approximation of the exact permutation null of Spearman's rho for n = 27 without ties (200,000 random permutations). I then checked whether rounding of the printed coefficients matters, what n each coefficient would need to meet its reported threshold, and whether the larger counts in the paper (all 47 recruited participants, or 54 = 27 × 2 electrodes) would reconcile the numbers. Every number below is printed by recompute.py.txt.
| Quantity | Location | Reported | Recomputed from the paper's numbers |
|---|---|---|---|
| Analysis sample | Results, Sample description; Table 3 title; Abstract | n = 27 | Supplementary Table 1: 47 rows, 27 marked as included (14 female; 12 mild, 14 moderate, 1 severe; age mean 32.4, SD 11.5, range 17–51) |
| Tone MMN amplitude vs PAL stages completed | Results; Fig. 5 | r = −0.26, P < 0.01 | t = −1.35, P = 0.19 (permutation 0.19); needs n ≥ 98 for P < 0.01 |
| Tone MMN latency vs KBIT-2 composite IQ | Results; Fig. 5 | r = −0.37, P < 0.0001 | t = −1.99, P = 0.057 (permutation 0.058); needs n ≥ 106 |
| Tone MMN latency vs KBIT-2 verbal IQ | Results; Fig. 5 | r = −0.31, P < 0.0001 | t = −1.63, P = 0.12; needs n ≥ 153 |
| Tone MMN latency vs KBIT-2 verbal raw | Results; Fig. 5 | r = −0.35, P < 0.0001 | t = −1.87, P = 0.074; needs n ≥ 119 |
| Tone MMN latency vs KBIT-2 non-verbal IQ | Results; Fig. 5 | r = −0.27, P < 0.001 | t = −1.40, P = 0.17; needs n ≥ 146 |
| Tone MMN latency vs PAL first trial memory | Results; Fig. 5 | r = −0.35, P < 0.0001 | t = −1.87, P = 0.074; needs n ≥ 119 |
| Tone MMN latency vs SRT total | Results; Fig. 5 | r = −0.30, P < 0.01 | t = −1.57, P = 0.13; needs n ≥ 73 |
| Tone MMN latency vs SRT SD | Results; Fig. 5 | r = 0.30, P < 0.001 | t = 1.57, P = 0.13; needs n ≥ 118 |
| Effect of rounding r by ±0.005 | derived | two decimals | P ranges stay within 0.054–0.199; none crosses 0.05 |
| Critical |r|, two-sided, n = 27 | derived | — | 0.381 (P < 0.05), 0.487 (P < 0.01), 0.597 (P < 0.001), 0.679 (P < 0.0001); permutation null agrees (tail shares 0.0107, 0.0013, 0.00016) |
| Correlations meeting alpha = 0.01 at n = 27 | derived | 8 of 8 ("significantly") | 0 of 8; 0 of 8 also at P < 0.05 |
| Correlations meeting their reported threshold at n = 47 or n = 54 | derived | 8 of 8 | 0 of 8 at either n (smallest: r = −0.37 gives P = 0.010 at n = 47, 0.0059 at n = 54) |
| Fig. 5 cell, MMN latency vs K-BIT 2 non-verbal raw | Fig. 5 (caption: P < 0.01) | −0.14, shown | P = 0.49 at n = 27; needs n ≥ 338 |
| Fig. 5 cell, K-BIT 2 verbal IQ vs SRT mean | Fig. 5 (caption: P < 0.01) | −0.11, shown | P = 0.58 at n = 27 (0.46 at n = 47); needs n ≥ 548 |
| Ordering of reported thresholds | Results | |r| = 0.30 at P < 0.01 and at P < 0.001; |r| = 0.27 at P < 0.001 | With a common n, equal |r| gives equal P and a smaller |r| gives a larger P; at n = 27, P(0.27) = 0.17 > P(0.30) = 0.13 |
| Repeated-measures df | Results, Linear mixed-effect models | F(2, 52) | (3 − 1) × (27 − 1) = 52, consistent with 27 participants contributing to the analyses |
Under the paper's own n, the eight correlations have P values between 0.057 and 0.19. The reported thresholds are smaller by factors of 10 to over 1,000. The exact permutation null gives the same answer as the t approximation to two decimals. The ordering check does not depend on n at all: the same |r| = 0.30 is reported once at P < 0.01 and once at P < 0.001, and |r| = 0.27 is given a smaller P than |r| = 0.30. If all correlations used the same participants, this ordering cannot occur.
Figure
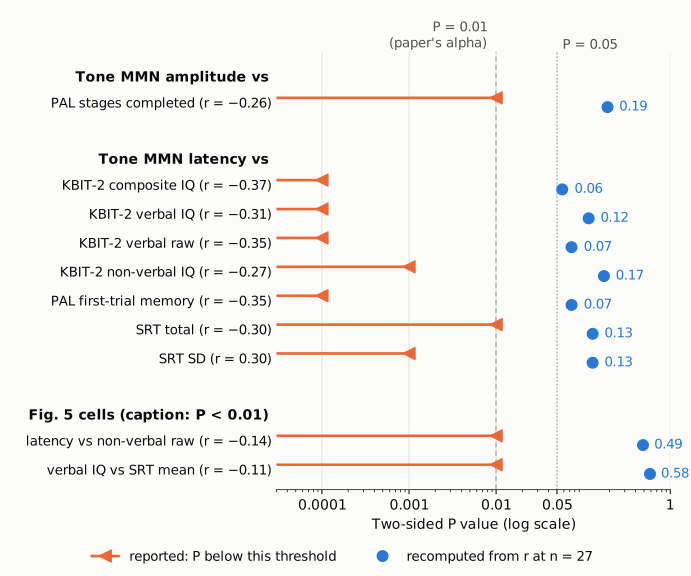
Figure 1. For each correlation the paper reports as significant, the orange bar ending in an arrowhead covers the range the paper claims ("P below this threshold"), and the blue dot is the two-sided P value recomputed from the printed coefficient at the stated n = 27 (t approximation; the permutation null gives the same values to two decimals). The axis is logarithmic. The dashed line marks the paper's alpha, P = 0.01, and the dotted line marks P = 0.05. The two lowest rows are cells displayed in Fig. 5, whose caption states P < 0.01. Every blue dot lies to the right of P = 0.05.
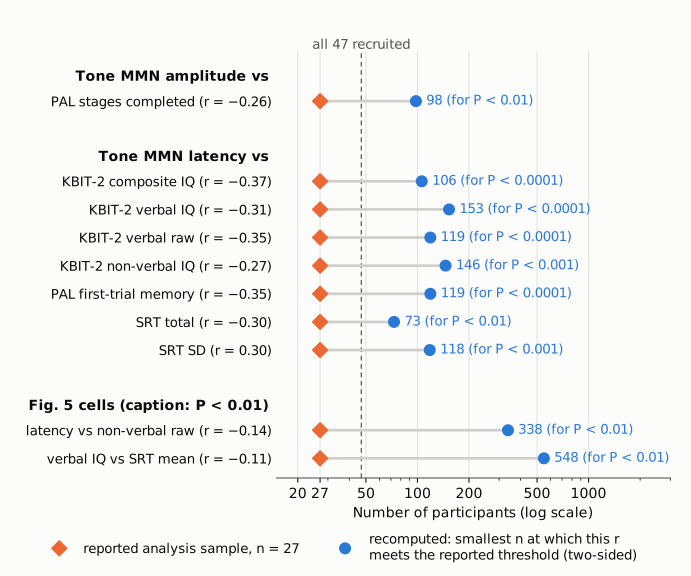
Figure 2. For each coefficient, the orange diamond marks the stated analysis sample (n = 27) and the blue dot the smallest sample at which that coefficient would meet the threshold printed next to it (two-sided t approximation). The dashed line marks the 47 recruited participants. The eight Results correlations would need 73 to 153 participants, between 2.7 and 5.7 times the analysed sample; the two Fig. 5 cells would need 338 and 548. Even all 47 recruited participants fall well short of every requirement.
Why it matters
The title ("The mismatch negativity as an index of cognitive abilities") and the Abstract's conclusion ("the MMN may represent a valuable index of cognitive abilities in DS") rest on these correlations. Apart from a mixed model of ERP amplitude by intellectual-disability level, which the paper reports as non-significant (F(4, 52) = 0.19, P = 0.94), no other analysis links the MMN to cognitive scores. In the Discussion, the correlations support three lines of argument: that MMN amplitude reflects memory (via CANTAB PAL), that MMN latency reflects speech-signal processing (via KBIT-2 verbal scores), and that latency reflects frontal white-matter integrity (via SRT standard deviation). The Conclusions sentence on "a more global detrimental effect on cognition" also rests on them.
At the paper's stated n and alpha, none of the eight correlations is statistically significant, and none would be significant at the conventional 0.05 level either. The coefficients themselves (|r| = 0.26–0.37) may be correct, but with 27 participants they are compatible with no association. The paper's limitation that the correlations were "conducted in an exploratory manner without correction for multiple comparisons" understates the problem: the issue is not a lack of multiplicity correction but that each uncorrected P value is above both thresholds.
Findings that do not depend on the correlations are not affected. These include the mixed-model result that the tone-deviant vs frequent contrast is significant at ages 26 and 31 but not 41, and the observation that MMN latencies are longer than canonical values.
Explanations considered
- Exact rather than approximate Spearman test. This does not account for the numbers. The Monte Carlo exact null for n = 27 gives P values within 0.003 of the t approximation (for example 0.058 vs 0.057 for r = −0.37), and its tail shares at the critical values match the nominal levels.
- Rounding of the printed coefficients. This does not account for the numbers. Moving each |r| by ±0.005 keeps every P between 0.054 and 0.199.
- One-sided tests. This does not account for the numbers. Halving the P values gives 0.029 to 0.095, still above 0.01 in every case, and the Methods do not mention one-sided tests.
- A larger n than 27 (all 47 recruited, or both electrodes pooled as 54 observations). This does not account for the numbers. The stated n of 27 is confirmed by Supplementary Table 1 and fits the mixed-model df of 52. Even at n = 47 or n = 54, none of the eight coefficients meets its reported threshold. The strongest, r = −0.37, gives P = 0.010 and 0.0059, against a reported P < 0.0001. Treating two electrodes from the same person as independent observations would not be valid in any case. The two Fig. 5 cells (−0.14 and −0.11) would need 338 and 548 observations.
- Pairwise missing data. This makes the discrepancy larger, not smaller. Any missing cognitive score lowers n below 27 and raises the P value.
- The printed values are a different coefficient (Kendall's tau) or a squared coefficient (r²). Neither accounts for the numbers. Read as Kendall's tau at n = 27, the printed values give P = 0.0068 to 0.057, and 0 of 8 meet their reported thresholds. Read as r² (so |r| = 0.51–0.61), they give P = 0.00076 to 0.0066, and 2 of 8 meet their thresholds. The Methods and the Fig. 5 caption both say Spearman's correlation.
- The P labels are mis-assigned between rows. This does not account for the numbers. Reassigning labels cannot help, because even the largest coefficient fails the paper's alpha. Under any single n, the reported thresholds are also not ordered by |r|: equal coefficients (0.30) carry different thresholds, and a smaller coefficient (0.27) carries a smaller threshold than a larger one (0.30).
- The Fig. 5 cells are filtered by some criterion other than P < 0.01. This is possible for the figure but does not change the text. The figure displays coefficients as small as −0.11, which no P < 0.01 criterion at n = 27 or n = 47 would pass, so the displayed cells were not selected by the criterion the caption states. The Results paragraph gives its own P values independently of the figure.
- Conversion or typesetting error in the archived text. This is excluded. The version of record, the PMC text and the Europe PMC full-text XML carry the same coefficients and P values, and the Fig. 5 image shows the same coefficients (see Status).
- The values are explained in a supplement. This is excluded. The only supplementary file is the participant table, which contains no MMN or cognitive scores and no alternative analysis.
The archived material does not show how the P values were produced, and the participant-level data needed to recompute the correlations are not published.
Status
- Version of record. The version of record at Oxford Academic (doi.org/10.1093/cercor/bhad233, which resolves to academic.oup.com/cercor/article/33/16/9639/7217126) was compared with the PMC archive. Its Results paragraph, sample description, alpha statement and Fig. 5 caption match the PMC text exactly, as does the Europe PMC full-text XML. Every quotation above was confirmed verbatim against the PMC-archived text with
src/show.py. The Fig. 5 coefficients were read from the figure image in the Europe PMC supplementary bundle (bhad233f5.jpg). - Supplements. The single supplementary file, Supplementary_Table_1_bhad233.docx (from the Europe PMC supplementaryFiles bundle), lists 47 participants with ID, study inclusion, age, sex, intellectual-disability level, Whisper hearing test, assessment gap and CAMDEX-DS decline. Of these, 27 are marked as included, with the same sex, intellectual-disability and age summary as the Results. The table contains no MMN or cognitive scores, so the correlations cannot be recomputed from it.
- Corrections and comments. As of 2026-10-24 I found no correction, erratum, expression of concern or retraction. Crossref lists no update relations for the DOI, and PMC and Europe PMC list no notices (
src/known.py). A web search for corrections or comments on the article found none. The PubPeer API and search page refused automated access (HTTP 404 on the API query and HTTP 403 on the search page), so PubPeer could not be checked directly. - Sources. PMC article PMC10431748; Europe PMC full-text XML and supplementary-files bundle for PMC10431748; Oxford Academic version of record; Crossref; Europe PMC.
Suggested correction
- Recompute the eight Spearman correlations in the Results from the participant-level data and report, for each, the coefficient, the number of participants contributing, and the exact two-sided P value. At n = 27, the printed coefficients imply P ≈ 0.06–0.19.
- If the recomputed P values do not meet the stated alpha of 0.01, remove "significantly" from the Results paragraph. Revise the Abstract ("Reduced MMN amplitude was associated with lower memory scores, while longer MMN latencies were associated with poorer memory, verbal abilities, and attention"), the Conclusions and the corresponding Discussion passages to describe these as non-significant exploratory associations. Reconsider the title claim that the MMN is "an index of cognitive abilities".
- Redraw Fig. 5 so that the displayed cells match the stated criterion, or state the criterion actually used. Report the n for each cell.
- State in the Methods how the correlation P values were computed (software, exact or approximate test, one- or two-sided, unit of analysis) so the results can be reproduced.