← Back to the plain-language case
Abstract states interaction explains 16.4% and 35.1% of AF risk; Table 3 gives 6.2% and 12.7%
Proc Natl Acad Sci U S A (2023) · doi:10.1073/pnas.2302708120 · PMC10410743
Summary
The abstract and Discussion state that around 16.4% (PM10) and 35.1% (NO2) of atrial fibrillation (AF) risk is attributable to the interaction between high air pollution and high genetic risk. Those two numbers are the relative excess risks due to interaction (RERI = 0.164 and 0.351 in Table 3) written as percentages. The measure that gives the share of risk attributable to interaction is the attributable proportion (AP), which Table 3 reports as 0.062 (95% CI 0.011 to 0.113) and 0.127 (0.055 to 0.200), that is 6.2% and 12.7%. Recomputing AP from the reported RERI and synergy index reproduces those table values, so the table is internally consistent and the abstract overstates the attributable share about 2.6-fold (PM10) and 2.8-fold (NO2). The direction and statistical significance of the additive interaction are unaffected.
What the paper reports
Abstract:
Moreover, the significant additive interactions between PM10 and NO2 and genetic risk on AF risk were observed, with around 16.4% and 35.1% of AF risk could be attributable to the interactive effects.
Discussion, paragraph 4:
Approximately 16.4 to 35.1% of AF risk can be explained by the additive effects of co-exposure to high air pollutants and high genetic risk, meaning that the combined effects of air pollutants and genetic risk were much greater than simply adding the two effects together. This finding has far-reaching implications for the field of environmental epidemiology, such as the provision of targeted preventive or medical care for the group of people at high genetic risk and exposed to severe levels of air pollutants.
Results, paragraph 2:
Notably, for participants with high air pollutants exposure and high genetic risk, the RERIs were 0.164 (0.027, 0.302) for PM10 and 0.351 (0.133, 0.568) for NO2, indicating the relative excess risk of AF onset in the context of genetic–air pollutants interactions of 0.164 and 0.351, respectively.
Materials and Methods, Statistical Analysis, paragraph 2:
To examine whether genetic predisposition modifies the associations of air pollutants with AF incidence, we fitted models on an additive scale and calculated the RERI, the AP, and the SI. If 0 is outside the CIs of RERI and AP, or 1 is outside the CIs of SI, it means that there is an additive interaction.
Table 3, "Additive interactions between air pollutants and PRS on the risk of incident AF" (excerpt, reformatted: the "High pollution" row of each pollutant, high genetic risk columns only; the medium genetic risk columns are left out). Per the table footnote, pollution is split at the WHO guideline values for PM2.5, PM10 and NO2 and at the median (42.20 μg/m3) for NOx. The table does not state the reference group; the standard additive-interaction reference, low genetic risk and low pollution, is assumed here.
Air pollutants (High pollution row) RERIs (95% CIs) APs (95% CIs) SIs (95% CIs) PM2.5 0.057 (-0.064, 0.178) 0.023 (-0.026, 0.073) 1.041 (0.954, 1.135) PM10 0.164 (0.027, 0.302) 0.062 (0.011, 0.113) 1.111 (1.015, 1.216) NO2 0.351 (0.133, 0.568) 0.127 (0.055, 0.200) 1.250 (1.091, 1.431) NOx 0.056 (-0.065, 0.177) 0.023 (-0.026, 0.072) 1.040 (0.954, 1.134)
Table 3 footnote (abbreviations):
AP, attributable proportion due to interaction
RERI, relative excess risk due to interaction; SI, synergy index.
What the paper's own numbers show
Method. With RR10, RR01 and RR11 the relative risks of the pollution-only, gene-only and doubly exposed groups against the doubly unexposed group, the standard additive-interaction measures are RERI = RR11 − RR10 − RR01 + 1, AP = RERI / RR11 and SI = (RR11 − 1) / [(RR10 − 1) + (RR01 − 1)]. RERI is an excess relative risk, in units of the reference group's risk. AP is the fraction of the doubly exposed group's risk that is due to the interaction, which is what the abstract's wording describes. The paper does not report RR11 for the binary groups used in Table 3, but it follows from the reported RERI and SI: the SI denominator equals (RR11 − 1) − RERI, so RR11 = 1 + SI · RERI / (SI − 1). I recovered RR11 this way for every Table 3 cell, recomputed AP = RERI / RR11, and compared both the tabled AP and the recomputed AP with the abstract's percentages. All numbers are printed by recompute.py.txt.
| Quantity | Location | Reported | Recomputed from the paper's numbers |
|---|---|---|---|
| Share of AF risk attributable to interaction, PM10 × high PRS | Abstract; Discussion para 4 | 16.4% | 6.2% (Table 3 AP 0.062; RERI / RR11 = 0.164 / 2.641 = 0.0621) |
| Share of AF risk attributable to interaction, NO2 × high PRS | Abstract; Discussion para 4 | 35.1% | 12.7% (Table 3 AP 0.127; RERI / RR11 = 0.351 / 2.755 = 0.1274) |
| RERI, PM10 × high PRS | Table 3; Results para 2 | 0.164 (0.027, 0.302) | 100 × RERI = 16.4%, identical to the abstract figure |
| RERI, NO2 × high PRS | Table 3; Results para 2 | 0.351 (0.133, 0.568) | 100 × RERI = 35.1%, identical to the abstract figure |
| Implied joint RR11, PM10 / NO2 (binary WHO guideline cut-offs) | From Table 3 RERI and SI | not reported | 2.641 / 2.755 |
| AP, PM10 × high PRS | Table 3 | 0.062 (0.011, 0.113) | 0.0621; consistent |
| AP, NO2 × high PRS | Table 3 | 0.127 (0.055, 0.200) | 0.1274; consistent |
| AP, PM2.5 and NOx × high PRS | Table 3 | 0.023, 0.023 | 0.0233, 0.0228; consistent |
| AP, medium PRS, four pollutants | Table 3 | 0.038, 0.024, 0.032, 0.032 | 0.0377, 0.0244, 0.0316, 0.0314; consistent to input rounding |
| Abstract figure / Table 3 AP | Abstract vs Table 3 | — | 2.65 (PM10), 2.76 (NO2) |
| Abstract figure vs upper 95% limit of AP | Abstract vs Table 3 | 16.4%, 35.1% | Both lie above the AP upper limits (11.3%, 20.0%) |
All three Table 3 statistics in each cell agree with one another, and the abstract's percentages agree only with RERI. The share of AF risk attributable to the gene-pollution interaction, as the paper itself estimates it, is 6.2% for PM10 and 12.7% for NO2.
Figure
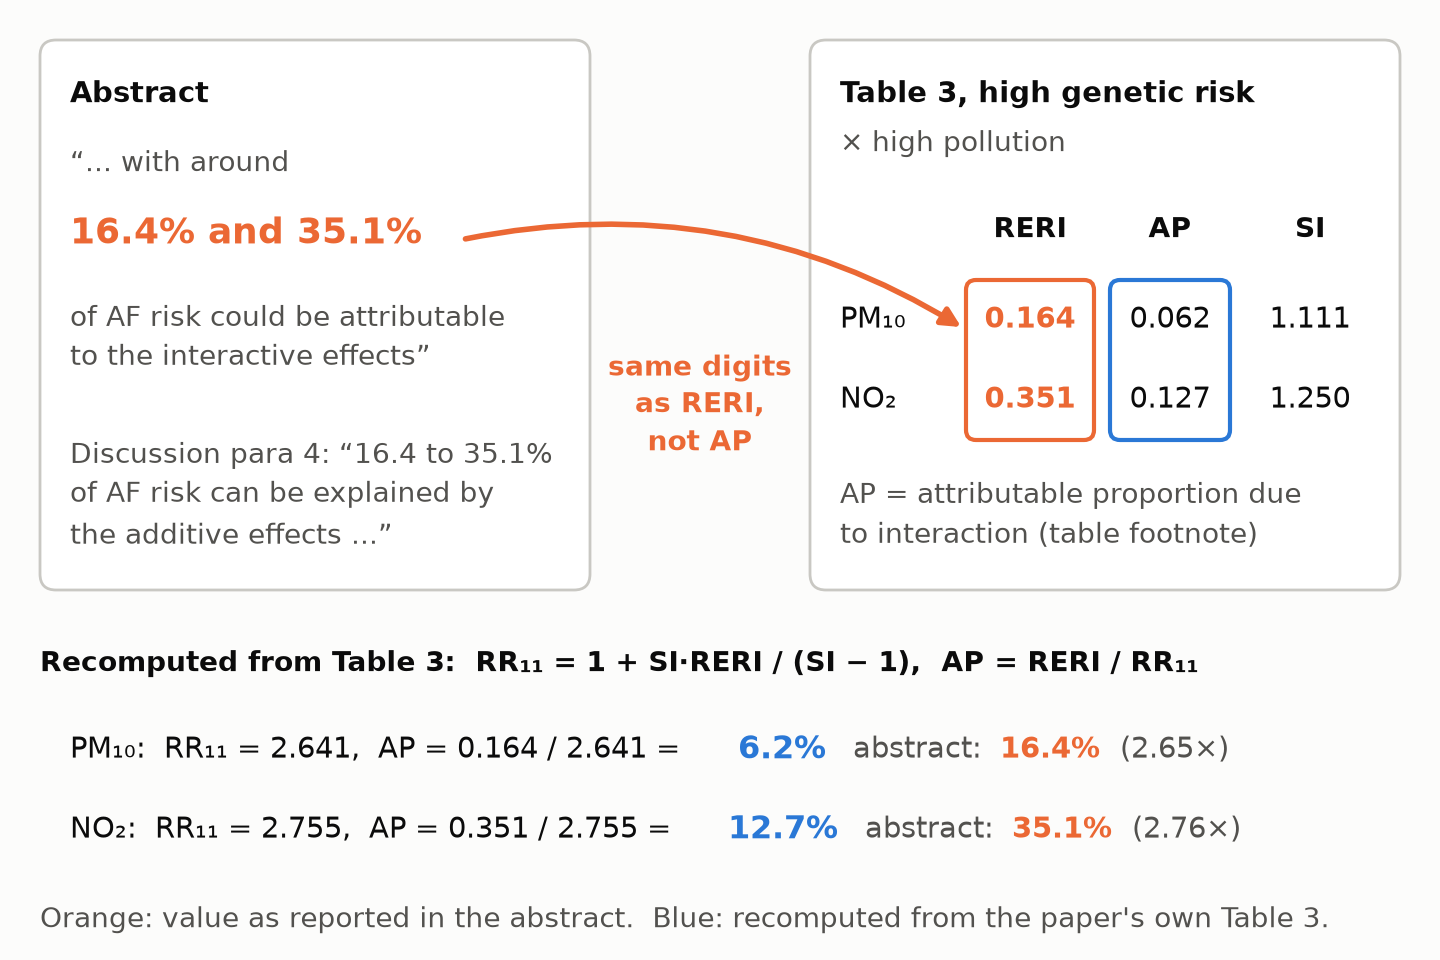
Figure 1. Left: the abstract's statement that "16.4% and 35.1%" of AF risk is attributable to the interaction (orange: the value as reported), with the matching Discussion sentence. Right: the Table 3 high-genetic-risk cells for PM10 and NO2. The connector shows that the abstract's figures repeat the RERI column digit for digit (orange outline), not the AP column, which the table footnote defines as the attributable proportion due to interaction. The blue outline marks the AP column, which the recomputation reproduces. Bottom: the joint relative risk RR11 recovered from the reported RERI and SI, and AP = RERI / RR11 (blue: recomputed from the paper's own numbers), which gives 6.2% and 12.7% against the abstract's 16.4% and 35.1%. All values are from the paper or printed by recompute.py.txt.
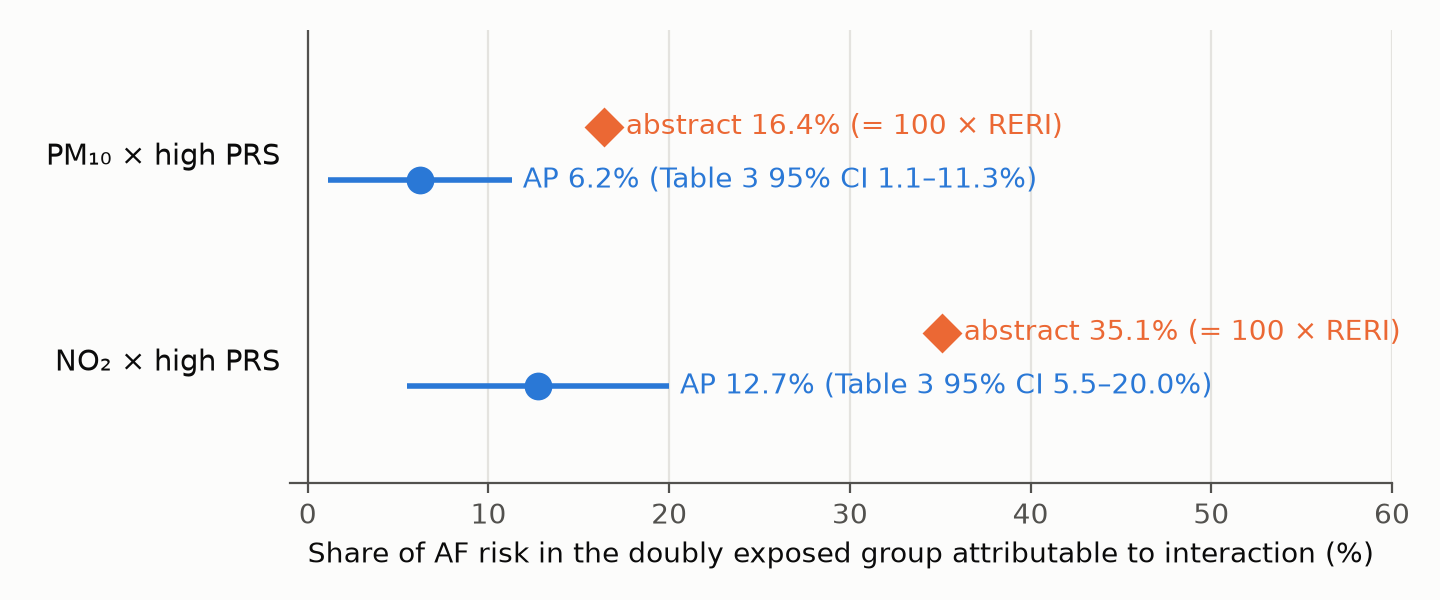
Figure 2. For each pollutant, the blue dot is the attributable proportion recomputed from Table 3's RERI and SI (6.2%, 12.7%) and the blue line is the 95% CI Table 3 reports for the AP (1.1 to 11.3%; 5.5 to 20.0%). The orange diamond is the share stated in the abstract (16.4%, 35.1%), which equals 100 × RERI. Both abstract figures lie outside the paper's own confidence intervals for the quantity they describe. The thin line marks 0, the null value for AP.
Why it matters
The attributable share is one of the abstract's headline quantitative results and is repeated in the Discussion, where it supports the argument for targeted prevention in people with high genetic risk who are highly exposed. Readers who take the figure from the abstract will think that roughly a sixth to a third of AF risk in the doubly exposed group comes from gene-pollution synergy, when the paper's own estimates are about a sixteenth to an eighth. Narrative reviews, risk communication and burden calculations that cite the abstract would carry the overstatement forward.
The qualitative findings stand. Table 3 shows positive additive interactions for PM10 and NO2 with high genetic risk, and the RERI, AP and SI intervals all exclude their null values, as the Methods' criterion requires. The per-IQR hazard ratios, the joint-effect estimates and the title, Significance statement and concluding paragraph, which mention additive interaction without these percentages, are not affected.
Explanations considered
- The percentages are APs from another model, group or category. They match the high-PRS × high-pollution RERIs in Table 3 to every digit (0.164, 0.351). The only APs Table 3 gives for those cells are 0.062 and 0.127, and the medium-PRS APs are smaller (0.024, 0.032). No other table in the paper or in the SI Appendix (Tables S1 to S17) reports additive-interaction measures. This does not account for the numbers.
- The Table 3 AP column is the one in error. AP rebuilt from the reported RERI and SI is 0.0621 and 0.1274, matching the tabled 0.062 and 0.127; the same check holds for all eight cells. The column order (RERI, AP, SI) is also confirmed in the publisher's XML. The table is internally consistent, so the AP column is not the error.
- "RERI × 100%" is a stated convention for the share of risk. The Methods and Table 3 footnote define RERI as the relative excess risk due to interaction and AP as the attributable proportion due to interaction, and the Results read 0.164 and 0.351 as relative excess risks. RERI is measured in units of the reference group's risk; it is not a fraction of the doubly exposed group's risk. The abstract's "of AF risk could be attributable" and the Discussion's "of AF risk can be explained" describe AP. This does not account for the numbers.
- Another denominator. The proportion of the joint excess risk due to interaction, RERI / (RR11 − 1), is 10.0% and 20.0%. Dividing RERI by the Fig. 2 joint hazard ratios for high genetic risk and the highest pollution quintile (2.817, 2.702), which use a different pollution grouping, gives 5.8% and 13.0%, or 9.0% and 20.6% with HR − 1. Using the Results text's PM10 value (2.871) instead gives 5.7% and 8.8%. None gives 16.4% and 35.1%.
- A text-conversion artifact. The publisher-supplied full text in PMC and the Europe PMC JATS XML carry the same abstract and Discussion sentences and the same Table 3 cells. The figures are not a conversion artifact.
A separate inconsistency lies outside this claim. Results paragraph 2 gives the PM10 joint hazard ratio (high pollution, high genetic risk) as 2.871 (2.579, 3.076), which would be 187.1% higher risk. The paper's own Fig. 2 (PM10 panel, row "High genetic risk, Q5") prints 2.817 (2.579, 3.076), which matches the abstract's 181.7% and the geometric midpoint of the interval (2.817). For PM2.5, NO2 and NOx the Results text, Fig. 2 and the abstract agree exactly. Only the Results text differs from the paper's own figure for PM10; 2.871 looks like a transposition of 2.817.
Status
As of 2026-10-24:
- Version of record. The PNAS page returned HTTP 403 to automated access after the doi.org redirect, so the publisher-supplied text was read from the PMC article and the Europe PMC JATS full-text XML. Both match the PMC archive in the abstract sentence, the Discussion sentence, the Results RERIs and every Table 3 cell. The publisher-deposited full text in PMC and Europe PMC carries the error; the PNAS page itself could not be accessed.
- Supplements. The SI Appendix (Appendix 01, 23 pages, Tables S1 to S17) has no RERI, AP or SI results and no other version of the 16.4% / 35.1% figures. It does not change or explain the discrepancy.
- Corrections. Crossref update metadata (no update-to or updated-by relations; a search for works updating this DOI returned none), PMC and Europe PMC notices (
src/known.py), and the PubMed record (PMID 37523535, no CommentsCorrections links) show no correction, erratum, expression of concern or retraction. The Europe PMC search API was unavailable (HTTP 503) on three tries; its full-text XML was readable. - PubPeer and other discussion. PubPeer refused direct fetches (HTTP 403); web searches found no PubPeer thread and no Retraction Watch coverage. The only outside commentary found, a Science Media Centre expert reaction, concerns exposure modelling and does not address this issue.
- Sources. doi.org/10.1073/pnas.2302708120 and pnas.org (403); PMC10410743 (text, Table 3, Fig. 2 image pnas.2302708120fig02.jpg, SI Appendix); Europe PMC full-text XML and supplementary files; Crossref REST API; PubMed; web searches for PubPeer and Retraction Watch.
Suggested correction
Abstract: replace "with around 16.4% and 35.1% of AF risk could be attributable to the interactive effects" with "with around 6.2% and 12.7% of AF risk among participants with high exposure and high genetic risk attributable to the interactive effects (relative excess risks due to interaction 0.164 and 0.351)". Discussion paragraph 4: replace "Approximately 16.4 to 35.1% of AF risk can be explained by the additive effects" with "Approximately 6.2 to 12.7% of AF risk in this group can be explained by the additive interaction". Results paragraph 2: replace the PM10 joint hazard ratio "2.871 (2.579, 3.076)" with "2.817 (2.579, 3.076)", the value shown in Fig. 2 and implied by the abstract's 181.7%.