← Back to the plain-language case
Abstract reports 1-year MACE-or-death rates as MACE rates for each perioperative myocardial injury aetiology
Eur Heart J (2023) · doi:10.1093/eurheartj/ehac798 · PMC10263270
Summary
The abstract says that 51%, 41%, 57%, 64% and 25% of patients with extra-cardiac PMI, type 1 MI (T1MI), tachyarrhythmia, acute heart failure (AHF) and likely type 2 MI (lT2MI) "had MACE" within 1 year, compared with 7% of patients without PMI. In the paper's own Table 2 these five numbers are the rates of the secondary composite endpoint, MACE or all-cause death (51%, 42%, 57%, 64%, 25%). The MACE rates in the same table, the Results text and the Discussion are 30%, 37%, 49%, 56% and 17%. The 7% comparator, however, is the no-PMI MACE rate; the no-PMI composite rate is 12%. So the abstract's headline sentence overstates the 1-year MACE risk for every aetiology (by 21 percentage points for extra-cardiac PMI and by 8.5 points for lT2MI, the most common aetiology), widens the contrast with patients without PMI, and reverses the order of extra-cardiac PMI and T1MI. The paper's qualitative conclusions and its adjusted hazard ratios are not affected.
What the paper reports
Abstract, Methods and results:
Major adverse cardiac events (MACEs) including acute myocardial infarction, AHF (both only from day 3 to avoid inclusion bias), life-threatening arrhythmia, and cardiovascular death as well as all-cause death were assessed during 1-year follow-up.
Outcomes differed starkly according to aetiology: in patients with extra-cardiac PMI, T1MI, tachyarrhythmia, AHF, and lT2MI 51%, 41%, 57%, 64%, and 25% had MACE, and 38%, 27%, 40%, 49%, and 17% patients died within 1 year, respectively, compared to 7% and 9% in patients without PMI.
Methods, Endpoints:
The primary endpoints were the occurrence of MACE and all-cause death following different PMI aetiologies within 1 year. [...] MACE was defined as a composite endpoint of acute myocardial infarction, AHF, life-threatening arrhythmia, and cardiovascular death. [...] A composite of MACE and all-cause death was a secondary endpoint.
Results, Follow-up:
At least one MACE occurred in 684/7754 patients at 1 year (8.8%). A total of 818/7754 patients died within 1 year (10.5%), with death occurring during the index hospitalization in 154/817 patients. The composite of MACE or all-cause death occurred in 1160/7754 patients (15.0%).
Results, MACE after PMI according to aetiology:
All PMI aetiologies showed substantially increased 1-year MACE rates vs. patients without PMI (7%, 95% CI 6%–8%), and there was a stark difference within PMI aetiologies (Table 2, Figure 3A): extra-cardiac PMI, T1MI, tachyarrhythmia, and AHF were associated with very high rates of MACE [30% (95% CI 20–47), 37% (95% CI 24–47), 49% (95% CI 34–75), and 56% (95% CI 38–70), respectively], and lT2MI was associated with high rates of MACE (17%, 95% CI 22%–28%).
Table 2, "Outcome following perioperative myocardial infarction/injury" (columns: No PMI, Type 1 MI, Tachy-arrhythmia, Acute heart failure, Likely type 2 MI, Extra-cardiac PMI sepsis, Extra-cardiac PMI other; n = 6738, 71, 47, 39, 750, 60, 49):
MACE at 1 year | 456 (7%)[6%–8%] | 26 (37%)[24%–47%] | 23 (49%)[34%–75%] | 22 (56%)[38%–70%] | 124 (17%)[14%–20%] | 18 (30%)[20%–47%] | 15 (31%)[17%–45%]
All-cause death within 1 year | 591 (9%)[8%–9%] | 20 (28%)[17%–38%] | 19 (40%)[25%–53%] | 19 (49%)[30%–62%] | 127 (17%)[14%–20%] | 21 (35%)[22%–46%] | 21 (43%)[27%–55%]
MACE or all-cause death at 1 year | 834 (12%)[12%–13%] | 30 (42%)[29%–53%] | 27 (57%)[41%–69%] | 25 (64%)[45%–76%] | 188 (25%)[22%–28%] | 32 (53%)[39%–64%] | 24 (49%)[23%–63%]
Discussion, second paragraph:
Second, the MACE and death rate differed substantially among PMI aetiologies: 5 of 10 patients with PMI due to AHF or tachyarrhythmia developed at least one MACE within 1 year, vs. 4 of 10 with T1MI, and 1.5 in 10 in lT2MI.
What the paper's own numbers show
Method. I took the event counts and group sizes printed in Table 2, summed the two extra-cardiac columns (sepsis, n = 60; other, n = 49) because the abstract reports extra-cardiac PMI as one group, and computed crude proportions (events / n) for MACE, all-cause death and MACE or all-cause death. Table 2's printed percentages equal these crude proportions after rounding in all 21 cells. I then checked that the Table 2 rows carry the right labels: their column sums against the totals in the Results text, and each composite count against the bounds it must satisfy (at least the larger of MACE and death, at most MACE plus non-cardiovascular death). Every number below is printed by recompute.py.txt.
| Quantity | Location | Reported | Recomputed from the paper's own numbers |
|---|---|---|---|
| Extra-cardiac PMI, "had MACE" | Abstract | 51% | MACE (18+15)/109 = 30.3%; MACE or death (32+24)/109 = 51.4% |
| T1MI, "had MACE" | Abstract | 41% | MACE 26/71 = 36.6%; MACE or death 30/71 = 42.3% |
| Tachyarrhythmia, "had MACE" | Abstract | 57% | MACE 23/47 = 48.9%; MACE or death 27/47 = 57.4% |
| AHF, "had MACE" | Abstract | 64% | MACE 22/39 = 56.4%; MACE or death 25/39 = 64.1% |
| lT2MI, "had MACE" | Abstract | 25% | MACE 124/750 = 16.5%; MACE or death 188/750 = 25.1% |
| No PMI comparator | Abstract | 7% | MACE 456/6738 = 6.8%; MACE or death 834/6738 = 12.4% |
| Extra-cardiac PMI from printed column percentages | Table 2 | 30%, 31% (MACE); 53%, 49% (composite) | MACE (60×30 + 49×31)/109 = 30.4%; composite (60×53 + 49×49)/109 = 51.2% |
| MACE rates by aetiology | Results text | 30, 37, 49, 56, 17% | match the MACE row above, not the abstract |
| Deaths at 1 year (same order) | Abstract | 38, 27, 40, 49, 17; 9% | 38.5, 28.2, 40.4, 48.7, 16.9; 8.8% (consistent; T1MI 1 point low) |
| Column sums of the MACE, death and composite rows | Table 2 vs Results text | 684, 818, 1160 | 684, 818, 1160 (exact) |
| Bound max(MACE, death) ≤ composite ≤ MACE + non-CV death | Table 2, all 7 columns | — | holds in every column (e.g. lT2MI 127 ≤ 188 ≤ 199) |
| lT2MI MACE 95% CI | Results text vs Table 2 | "17%, 95% CI 22%–28%" vs [14%–20%] | 22%–28% is the composite's interval in Table 2; a Wilson interval on 124/750 is 14.0%–19.4% |
Four of the five PMI values in the abstract equal the rounded composite (MACE or all-cause death) rate; the fifth, T1MI, is 41% against a composite of 42.3% and a MACE rate of 36.6%, so it too sits with the composite. The abstract's death figures all match the all-cause death row. The no-PMI comparator in the same sentence, 7%, matches the MACE row and not the composite (12.4%). Because the Table 2 rows sum exactly to the separately stated totals and respect the logical bounds between them, the table's labels are internally consistent, and the mismatch lies in the abstract's label.
Figure
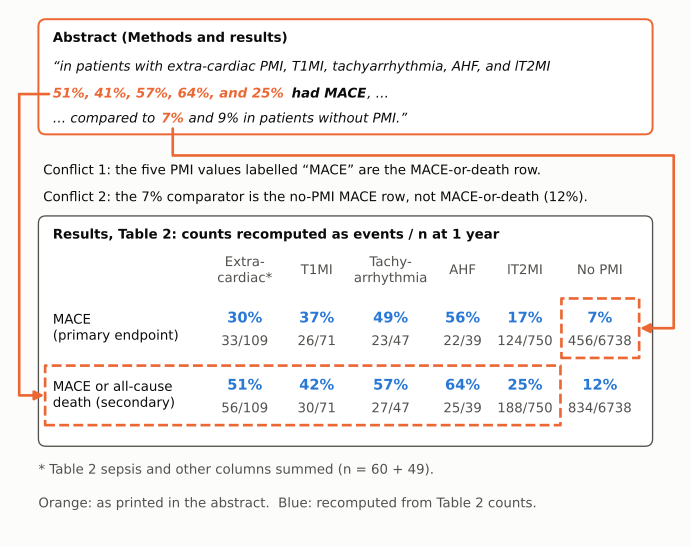
Figure 1. The abstract sentence (top; values printed in the abstract in orange) set against the two relevant Table 2 rows, with each rate recomputed in blue from the table's own counts (bottom). The left connector shows that the five PMI values printed under the label "MACE" (51%, 41%, 57%, 64%, 25%) correspond to the secondary composite row, MACE or all-cause death (51%, 42%, 57%, 64%, 25%), not to the MACE row (30%, 37%, 49%, 56%, 17%). The right connector shows that the comparator in the same sentence, 7%, corresponds to the no-PMI MACE row; the no-PMI composite rate is 12%. Extra-cardiac PMI is the sum of the table's sepsis and other columns (n = 60 + 49).
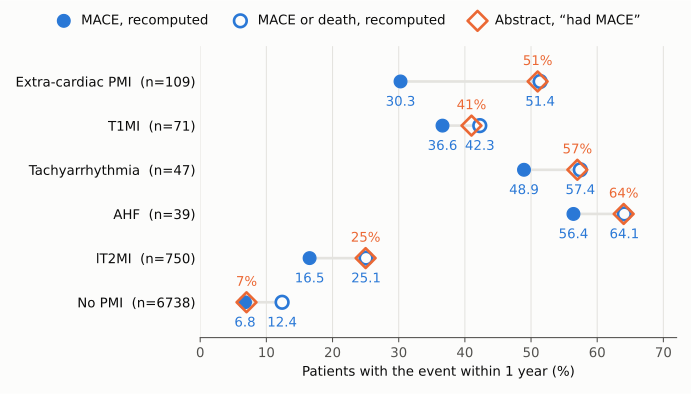
Figure 2. For each group, the recomputed 1-year MACE rate (filled blue circle), the recomputed MACE-or-death rate (open blue circle) and the value the abstract prints as "had MACE" (orange diamond), on a linear axis starting at zero. For all five PMI aetiologies the abstract value sits on or next to the composite, and the gap to the true MACE rate is 4 to 21 percentage points. For the no-PMI group the abstract value sits on the MACE rate. All values are crude proportions from Table 2 counts, which reproduce the table's printed percentages.
Why it matters
- The abstract's absolute risk estimates for a primary endpoint are overstated. MACE is a primary endpoint. The abstract's "had MACE" figures exceed the true MACE rates by 20.7 points for extra-cardiac PMI (68% relative), 4.4 for T1MI (12%), 8.1 for tachyarrhythmia (16%), 7.6 for AHF (13%) and 8.5 for lT2MI (51%). lT2MI is 750/1016 (73.8%) of all PMI, so the most frequently applicable figure is half again too high: about 1 in 4 rather than the Discussion's "1.5 in 10".
- The contrast with patients without PMI is inflated. Composite rates in the PMI groups are set against the MACE-only rate in the no-PMI group. Read at face value, the abstract implies that lT2MI carries 25/7 = 3.6 times the no-PMI MACE risk; the MACE-to-MACE ratio is 2.4 and the composite-to-composite ratio is 2.0. For extra-cardiac PMI the implied 7.3 compares with 4.5 for MACE and 4.2 for the composite.
- The ranking of aetiologies changes. In the abstract, extra-cardiac PMI (51%) appears to carry a higher MACE risk than T1MI (41%). On the MACE endpoint the order is reversed (30.3% vs 36.6%), consistent with the Results text and with the adjusted hazard ratios (3.0 vs 3.2).
- What is not affected. Every PMI aetiology still has higher 1-year MACE and death rates than patients without PMI, the multivariable adjusted hazard ratios (Table 3) are reported separately and are unchanged, and the Results text, Table 2 and Discussion give the correct MACE rates. The error is in how the abstract labels and juxtaposes the figures, which are the absolute risks a reader of the abstract alone is most likely to quote.
- A related slip in the Results text. The lT2MI MACE rate is given as "17%, 95% CI 22%–28%". An interval that excludes its own point estimate cannot be right; 22%–28% is the composite's interval in Table 2, and the MACE interval there is 14%–20%.
Explanations considered
- The Table 2 rows, not the abstract, are mislabelled. Ruled out. The MACE, all-cause death and composite rows sum to 684, 818 and 1160, exactly the totals the Results text gives for MACE, death and MACE or death. In every column the composite count lies between the larger of MACE and death and the sum of MACE and non-cardiovascular death, which is what a correctly labelled composite must do.
- "MACE" in the abstract means MACE including all-cause death. Ruled out. The abstract's own Methods sentence defines MACE as acute MI, AHF, life-threatening arrhythmia and cardiovascular death, "as well as all-cause death", listing death as a separate outcome; the Methods define MACE without non-cardiovascular death and make the composite with all-cause death a separate, secondary endpoint. The same abstract sentence reports deaths separately, and its no-PMI comparator (7%) is the MACE-only rate.
- Kaplan–Meier estimates rather than crude proportions. Does not account for it. The Methods say the univariable analysis used Kaplan–Meier estimates, and Table 2's footer says its intervals come from survival analysis, but the printed Table 2 percentages equal the crude proportions, and the Results text gives MACE rates of 30, 37, 49, 56 and 17%. No reading of the MACE endpoint in the paper yields 51, 41, 57, 64 and 25%. Censoring could explain the 1-point T1MI difference (41% vs 42.3%), not the 4- to 21-point gaps to MACE.
- A different time point. Ruled out. The abstract states 1 year, as does Table 2. The only other horizon in the paper, 120 days, is used for the lT2MI prognostic model, and rates over a shorter window would be lower, not higher.
- Adjusted rather than unadjusted figures. Ruled out. The abstract gives percentages of patients, not hazard ratios, and the next sentence ("These associations persisted in multivariable analysis") refers to the adjusted analysis separately.
- Extra-cardiac PMI defined differently in the abstract. Does not account for it. Summing the two extra-cardiac columns gives 30.3% for MACE and 51.4% for the composite; weighting the printed column percentages gives 30.4% and 51.2%. Only the composite matches the abstract's 51%.
- Text-conversion artefact in the PMC copy. Ruled out. The version of record on the publisher's site, the Europe PMC full-text XML and the PubMed record carry the same abstract sentence and the same Table 2 cells.
No explanation was found under which the five abstract values are 1-year MACE rates. The figures are consistent with the composite row having been used in place of the MACE row for the PMI groups only.
Status
As of 2026-10-24:
- Version of record. The publisher's article page (reached through doi.org) has the same abstract sentence ("51%, 41%, 57%, 64%, and 25% had MACE ... compared to 7% and 9% in patients without PMI") and the same Table 2 cells as PMC; the Results text there also gives "17%, 95% CI 22%–28%" for lT2MI. The Europe PMC full-text XML and the PubMed record (PMID 36705050) agree. The publisher's structured graphical abstract gives per-aetiology MACE rates that match the Table 2 MACE row (37, 49, 56, 17, 30 and 7%), not the abstract text.
- Supplement. The supplementary data file (ehac798_Supplementary_Data.docx) was checked. Its Table S1 gives MACE within 1 year as 456 (7%) for no PMI and 228 (23%) for PMI overall; the count equals the sum of the Table 2 MACE counts over the PMI groups (26+23+22+124+18+15 = 228). It does not give per-aetiology 1-year MACE rates that would support the abstract values.
- Corrections. No correction, erratum, expression of concern or retraction is listed in Crossref, PubMed Central or Europe PMC.
- PubPeer. A web search found no PubPeer entry for the article; PubPeer's own search could not be queried directly from this machine (it requires interactive verification), so the absence of comments there is not confirmed.
- Sources. PMC10263270 as archived in PubMed Central; https://doi.org/10.1093/eurheartj/ehac798; Europe PMC full text and supplementary files for PMC10263270; PubMed 36705050; Crossref metadata for the DOI.
Suggested correction
In the abstract, replace
in patients with extra-cardiac PMI, T1MI, tachyarrhythmia, AHF, and lT2MI 51%, 41%, 57%, 64%, and 25% had MACE, and 38%, 27%, 40%, 49%, and 17% patients died within 1 year, respectively, compared to 7% and 9% in patients without PMI.
with
in patients with extra-cardiac PMI, T1MI, tachyarrhythmia, AHF, and lT2MI 30%, 37%, 49%, 56%, and 17% had MACE, and 38%, 28%, 40%, 49%, and 17% patients died within 1 year, respectively, compared to 7% and 9% in patients without PMI.
(the MACE and death figures from Table 2 and the Results text). If the composite is meant to be reported, the sentence should instead name it ("51%, 42%, 57%, 64%, and 25% had MACE or died") and give the matching no-PMI composite rate, 12%. Separately, in the Results, the lT2MI MACE interval "95% CI 22%–28%" should read "95% CI 14%–20%", as in Table 2.