← Back to the plain-language case
Abstract reports the severe-obesity odds ratio from the worsening-dyspnoea model instead of the improvement model
Lancet Reg Health Eur (2023) · doi:10.1016/j.lanepe.2023.100635 · PMC10145209
Summary
The abstract reports that hospitalised COVID-19 patients who were not severely obese had higher odds of improvement in dyspnoea between 5 months and 1 year, with an odds ratio of 4.19 (95% CI 2.14–8.19). Six of the seven abstract estimates are exact reciprocals of the primary-outcome model in Table 2, which gives 0.36 (0.18–0.72) for severe obesity. Its reciprocal is 2.78 (1.39–5.56). The printed 4.19 (2.14–8.19) is, digit for digit, the Table 3 estimate for severe obesity in a different model: the exploratory outcome of developing or worsening dyspnoea, fitted in a different analysis sample (n = 1151 rather than 990). The direction and significance are unchanged. The abstract still overstates the primary-outcome effect by about 51% and places its lower confidence limit at 2.14 instead of 1.39. Readers, data extractors and meta-analysts often take estimates from the abstract.
What the paper reports
Abstract, Findings:
We observed higher odds of improvement between 5-month and 1-year follow-up among PHOSP-COVID participants who were younger (odds ratio 1.02 per year, 95% CI 1.01–1.03), male (1.54, 1.16–2.04), neither obese nor severely obese (1.82, 1.06–3.13 and 4.19, 2.14–8.19, respectively), had no pre-existing anxiety or depression (1.56, 1.09–2.22) or cardiovascular disease (1.33, 1.00–1.79), and shorter hospital admission (1.01 per day, 1.00–1.02).
Methods, Outcomes, first paragraph (the primary outcome):
Specifically, the primary outcome was participant-reported improvement in dyspnoea between 5-month and 1-year follow-up, defined as a reduction (at least by 1 point) in the MRC Dyspnoea score between the two timepoints.
Methods, Outcomes, second paragraph (the exploratory outcome):
Therefore, the exploratory outcome variable we defined based on the 1-year and baseline MRC Dyspnoea scores was long-term post-COVID-19 dyspnoea (i.e., worsening dyspnoea over 1 year).
The analysis of this exploratory outcome aimed to answer a different question
Table 2 caption, column headers, BMI rows and footer (PHOSP-COVID n = 990 for the first three columns, COVIDENCE UK n = 3309 for the last two):
Associations between participant characteristics and improvement of dyspnoea symptoms from 5 months to 1 year.
| Univariable | Multivariable (including hospitalisation variables) | Multivariable (excluding hospitalisation variables) | Univariable | Multivariable
30 to <40 (obese) | 0.57 (0.34–0.95) | 0.55 (0.32–0.94) | 0.58 (0.34–0.99) | 0.65 (0.54–0.80) | 0.62 (0.50–0.75)
≥40 (severely obese) | 0.43 (0.22–0.84) | 0.36 (0.18–0.72) | 0.38 (0.19–0.75) | 0.70 (0.48–1.01) | 0.51 (0.34–0.75)Data are odds ratio (95% CI), with worse or persistent dyspnoea as the reference category.
Table 3 caption, BMI rows and footer (same column order; PHOSP-COVID n = 1151):
Associations between participants characteristics and development or worsening of dyspnoea symptoms at 1 year.
30 to <40 (obese) | 2.00 (1.26–3.15) | 2.22 (1.35–3.64) | 2.20 (1.35–3.57) | 2.34 (2.02–2.72) | 3.46 (2.95–4.06)
≥40 (severely obese) | 3.14 (1.70–5.79) | 4.19 (2.14–8.19) | 4.23 (2.18–8.23) | 3.01 (2.20–4.13) | 5.98 (4.24–8.43)Data are odds ratio (95% CI), with stable or improved dyspnoea as the reference category.
Results, third paragraph (the only place the text cites the improvement estimates for BMI; it gives no number):
We observed reduced odds of improved dyspnoea from 5 months to 1 year after discharge among patients hospitalised with COVID-19 who were older, female, obese or severely obese, and with pre-existing depression or anxiety (Table 2; Fig. 2).
What the paper's own numbers show
Method. In the abstract each determinant is stated at its favourable level ("younger", "male", "neither obese nor severely obese", "no ... cardiovascular disease"). Table 2 states the adverse level against the reference. So each abstract figure should be the Table 2 odds ratio with the comparison reversed: OR becomes 1/OR, and a CI (l, u) becomes (1/u, 1/l). I applied this to every column of Table 2 to find the one the abstract uses, and compared each abstract figure with Table 3 as well. As an external check of the Table 2 severe-obesity row, I also recomputed the crude odds ratio from the Table 1 counts. Every number below is printed by recompute.py.txt.
| Quantity | Location | Reported | Recomputed from the paper's own numbers |
|---|---|---|---|
| Age, per year younger | Abstract vs Table 2 (multivariable incl. hosp.) | 1.02 (1.01–1.03) | 1/0.98 (0.97–0.99) = 1.02 (1.01–1.03): matches |
| Male vs female | Abstract vs Table 2 | 1.54 (1.16–2.04) | 1/0.65 (0.49–0.86) = 1.54 (1.16–2.04): matches |
| Not obese vs obese (BMI 30 to <40) | Abstract vs Table 2 | 1.82 (1.06–3.13) | 1/0.55 (0.32–0.94) = 1.82 (1.06–3.125): matches |
| No depression or anxiety | Abstract vs Table 2 | 1.56 (1.09–2.22) | 1/0.64 (0.45–0.92) = 1.56 (1.09–2.22): matches |
| No cardiovascular disease | Abstract vs Table 2 | 1.33 (1.00–1.79) | 1/0.75 (0.56–1.00) = 1.33 (1.00–1.79): matches |
| Shorter stay, per day | Abstract vs Table 2 | 1.01 (1.00–1.02) | 1/0.99 (0.98–1.00) = 1.01 (1.00–1.02): matches |
| Not severely obese vs BMI ≥40 | Abstract vs Table 2 | 4.19 (2.14–8.19) | 1/0.36 (0.18–0.72) = 2.78 (1.39–5.56): does not match |
| Severely obese, same model, other outcome | Table 3, multivariable incl. hosp. | 4.19 (2.14–8.19) | identical to the abstract figure |
| Ratio of abstract to recomputed point estimate | — | — | 4.19 / 2.778 = 1.51 (+51%) |
| Table 2 OR that would invert to 4.19 | Table 2, severely obese, multivariable incl. hosp. | 0.36 | 1/4.19 = 0.239; any value that rounds to 0.36 inverts to 2.74–2.82 |
| Severely obese, other Table 2 columns, inverted | Table 2 | 0.43 (0.22–0.84); 0.38 (0.19–0.75) | 2.33 (1.19–4.55); 2.63 (1.33–5.26) |
| Severely obese, appendix sensitivity analyses, inverted | Appendix Table S1 | 0.35 (0.17–0.72); 0.35 (0.17–0.70); 0.37 (0.14–0.93); 0.28 (0.13–0.60); 0.34 (0.17–0.69) | 2.86 (1.39–5.88); 2.86 (1.43–5.88); 2.70 (1.08–7.14); 3.57 (1.67–7.69); 2.94 (1.45–5.88) |
| Crude OR, severely obese vs BMI <25, improvement | Table 1 counts (improved/worse-or-persistent: 25/61 vs 34/36; the 692 participants with BMI recorded) | Table 2 univariable 0.43 (0.22–0.84) | (25/61)/(34/36) = 0.434 (Wald CI 0.224–0.840): matches |
| Internal consistency of the Table 2 cell | Table 2 | 0.36 (0.18–0.72) | geometric CI midpoint 0.360 |
| Ratio of severe-obese to obese estimates in the abstract | Abstract | 4.19 / 1.82 = 2.30 | 2.778 / 1.818 = 1.53 |
The abstract and Table 2 use one convention throughout: six of the seven abstract estimates are reciprocals of the PHOSP "Multivariable (including hospitalisation variables)" column, to the printed precision. The seventh, for severe obesity, cannot be produced from any improvement-outcome estimate in the paper or appendix: the ten candidates invert to between 1.43 and 3.57, and none to 4.19 (2.14–8.19). Outside the abstract, the same three numbers appear only once in the paper, in the Table 3 cell for severe obesity in the multivariable model including hospitalisation variables. That model has a different outcome, a different reference category ("stable or improved dyspnoea") and a different PHOSP sample (n = 1151). The Table 3 odds ratio is greater than 1 because it describes the adverse outcome, so it reads plausibly in the abstract's favourable-level phrasing. It is still not the improvement estimate. The Table 2 cell itself is supported by its neighbouring models, by all five sensitivity analyses, and by a crude odds ratio recomputed from the Table 1 counts.
Figure
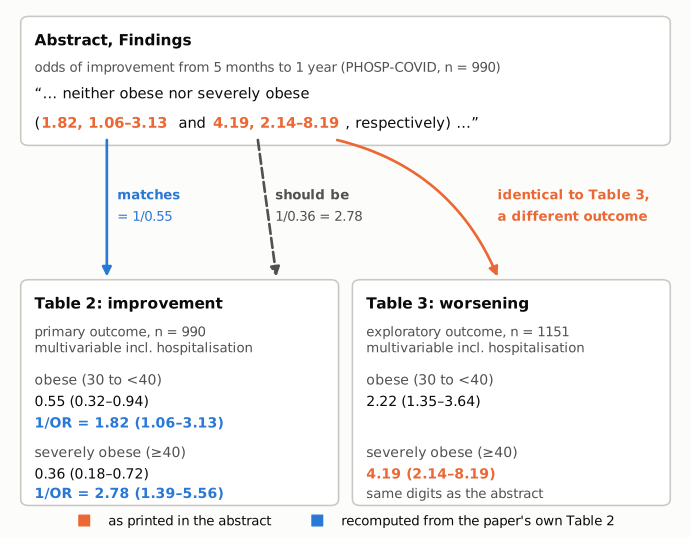
Figure 1. Where the two BMI estimates in the abstract's Findings come from. Top panel: the abstract excerpt, with its printed values in orange. Bottom left: Table 2 (primary outcome, improvement; PHOSP-COVID n = 990; multivariable model including hospitalisation variables), with the printed odds ratios in black and their reciprocals, recomputed for the abstract's favourable-level comparison, in blue. Bottom right: Table 3 (exploratory outcome, development or worsening; n = 1151; same model specification). The obese estimate, 1.82 (1.06–3.13), is the reciprocal of Table 2's 0.55 (0.32–0.94). The severe-obesity estimate should be the reciprocal of Table 2's 0.36 (0.18–0.72), which is 2.78 (1.39–5.56). The printed 4.19 (2.14–8.19) matches the Table 3 severe-obesity cell exactly.
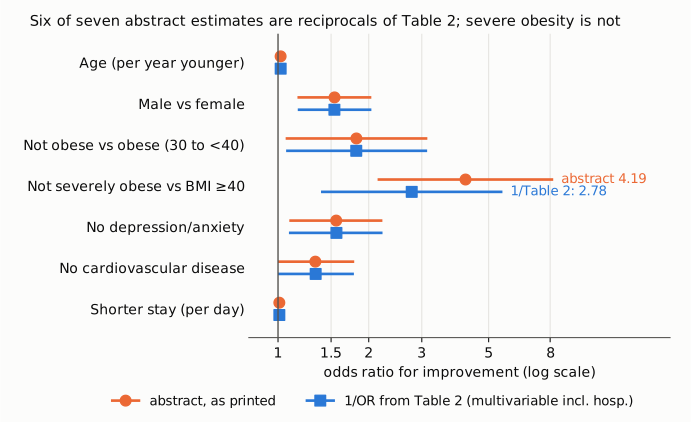
Figure 2. All seven odds ratios in the abstract's Findings (orange circles, as printed) next to the reciprocals of the corresponding Table 2 estimates (blue squares; PHOSP multivariable model including hospitalisation variables), with 95% CIs, on one log-scaled axis. The vertical line marks OR = 1. For six determinants the two intervals coincide to the printed precision. For severe obesity the printed estimate, 4.19 (2.14–8.19), lies well to the right of the value implied by Table 2, 2.78 (1.39–5.56). Both intervals exclude 1. The figure shows that the error is confined to one figure and that the convention the abstract uses is not in doubt.
Why it matters
- A primary-outcome effect size in the abstract is wrong. Severe obesity is one of the determinants the abstract names for the primary outcome. The estimate printed for it is about 1.5 times the value the paper's own primary model gives, and its lower confidence limit is printed as 2.14 instead of 1.39.
- It distorts the obesity gradient. As printed, the severe-obesity effect is 2.3 times the obesity effect (4.19 vs 1.82). The paper's Table 2 implies a ratio of about 1.5 (2.78 vs 1.82), with heavily overlapping confidence intervals. A reader of the abstract would infer a much steeper dose-response with BMI than the improvement analysis shows.
- Abstracts feed evidence synthesis. Systematic reviewers, guideline writers and data extractors often take estimates from abstracts. A pooled analysis of severe obesity and post-COVID-19 dyspnoea recovery that used this abstract would enter a value from a different outcome and sample.
- What does not change. Direction and statistical significance are the same with either value, so the abstract's qualitative statement ("neither obese nor severely obese" is associated with higher odds of improvement) and the Interpretation hold. Tables 2 and 3, the Results text, the Discussion and the forest plot (Fig. 2) are not affected. The underlying regressions are not in question; only the number carried into the abstract is.
Explanations considered
- A different column of Table 2. The univariable estimate 0.43 inverts to 2.33 (1.19–4.55). The model excluding hospitalisation variables, 0.38, inverts to 2.63 (1.33–5.26). The COVIDENCE UK columns invert to 1.43 and 1.96. None gives 4.19. The six correctly reproduced abstract figures (including length of hospital stay, which appears only in the model including hospitalisation variables) fix the column used as the PHOSP multivariable model including hospitalisation variables.
- A sensitivity analysis. The five severe-obesity estimates in appendix Table S1 invert to 2.70–3.57. None gives 4.19 (2.14–8.19), and the string "4.19 (2.14–8.19)" does not occur in the appendix.
- Rounding. Any odds ratio that rounds to 0.36 inverts to between 2.74 and 2.82. To invert to 4.19, the Table 2 value would have to be about 0.24.
- An error in Table 2 rather than in the abstract. Unlikely. The Table 2 cell is internally consistent (the geometric midpoint of 0.18–0.72 is 0.360). It sits close to the neighbouring models (0.43 univariable, 0.38 excluding hospitalisation variables) and to all five sensitivity analyses (0.28–0.37). Its univariable neighbour, 0.43 (0.22–0.84), is reproduced to the printed precision by the crude odds ratio from the Table 1 counts. The forest plot (Fig. 2, left panel, improvement) also shows the PHOSP severe-obesity estimate below 1, in line with Table 2.
- The abstract figure is meant to describe the exploratory outcome. Not consistent with the text. The abstract sentence is about "higher odds of improvement between 5-month and 1-year follow-up", and the other six figures in the same sentence, including the obese figure next to it, come from Table 2. Table 3 uses a different outcome, reference category and sample (n = 1151, the 1188 participants with recalled pre-COVID-19 scores minus 37 with a score of 5). Its obese estimate, 2.22 (1.35–3.64), is not the abstract's 1.82, so the abstract does not report Table 3 consistently either.
- A conversion or archiving artefact. Ruled out. The same values appear in the current PMC version of the article (PMC10145209.2), in the Europe PMC full text, and in the publisher's typeset PDF (version of record).
- Another legitimate reading of "neither obese nor severely obese". The phrase could be read as a comparison against the BMI <25 reference group rather than a literal reversal. Either way, the abstract's obese figure equals 1/0.55 from Table 2, so the severe-obesity figure on the same reading would be 1/0.36 = 2.78.
Status
- Version of record. Checked. The publisher's typeset PDF (Elsevier/thelancet.com footer, 19 pages; obtained from the Oxford ORA repository record labelled "Version of record", ora.ox.ac.uk) has the same abstract sentence and the same Table 2 and Table 3 rows. The publisher's own pages (thelancet.com, sciencedirect.com) refused automated requests (HTTP 403). PMC lists two versions of the article (PMC10145209.1 and .2). The current version, .2 (PMC OAI full text), and the Europe PMC full-text XML carry the same values. Version .1 could not be retrieved separately.
- Supplement. Checked. Appendix (mmc1.docx, from the Europe PMC supplementary files) Table S1, "Sensitivity analyses for predicting improvement of dyspnoea symptoms from the 5-month to 1-year visits of PHOSP study", gives severe-obesity improvement odds ratios of 0.28–0.37, none of which inverts to 4.19. The appendix's only "4.19" is an unrelated MRC-score entry. Fig. 2 shows the estimate of about 4.2 only in its development-or-worsening panel.
- Corrections and retractions. None found as of 2026-10-24: Crossref lists no update for the DOI, PMC and Europe PMC list no correction or retraction notice linked to the article (PMID 37261214), and a web search for an erratum returned none.
- PubPeer. No thread found in a web search for the DOI or title. PubPeer's own search API answered "Human verification required" and could not be queried automatically, so a thread cannot be fully ruled out.
- Sources. PMC10145209 (current version .2) and the PMC ID converter, Europe PMC full text, metadata and supplementary files, Crossref (no works with an
updatesrelation to the DOI), ORA version-of-record PDF, web searches. All as of 2026-10-24.
Suggested correction
In the abstract, Findings, replace
neither obese nor severely obese (1.82, 1.06–3.13 and 4.19, 2.14–8.19, respectively)
with
neither obese nor severely obese (1.82, 1.06–3.13 and 2.78, 1.39–5.56, respectively)
Here 2.78 (1.39–5.56) is the reciprocal of the Table 2 estimate 0.36 (0.18–0.72), computed from the rounded published values. The authors may prefer to recompute it from the unrounded model output. No change is needed to the tables, the Results text, the Discussion or the conclusions.