← Back to the plain-language case
Headline protection p-value cannot be reproduced from the paper's counts using its stated test
Nat Commun (2023) · doi:10.1038/s41467-023-36907-0 · PMC9990026
Summary
The paper reports that after nine repeated low-dose intrarectal SIVmac251 challenges, 4 of 7 vaccinated macaques and 6 of 6 controls were infected, giving a vaccine efficacy (VE) of 43%, and attaches "P < 0.0001" to that result. The paper says this comparison used a one-tailed Fisher's exact test. Applied to the paper's own counts (3/7 vs 0/6 uninfected), that test gives p = 35/286 = 0.122 (two-tailed 0.192), which is above the paper's significance threshold of 0.05. With 7 vs 6 animals, no Fisher (conditional) or permutation test can give a p-value below 1/1716 = 5.8 × 10⁻⁴. Unconditional exact tests (Barnard, Boschloo) cannot go below (7/13)⁷(6/13)⁶ = 1.3 × 10⁻⁴, and a large-sample two-sided log-rank test on any 7-vs-6 outcome cannot go below 1.7 × 10⁻⁴. Each of these floors is above 0.0001, so none of these tests can produce "P < 0.0001" with these group sizes, whatever the outcome. The 43% point estimate is arithmetically correct. The statistical significance claimed for the paper's primary protection result is not supported.
What the paper reports
Results, section "Tonsil vaccination with MVA prevented acquisition in 3/7 animals after 9 repeated low dose IR challenges with SIVmac251", first paragraph:
All 6/6 control animals were infected by the 9th low dose IR challenge whereas only 4/7 vaccinated animals were infected by the 9th challenge demonstrating a VE = 43% (Fig. 2a; P < 0.0001).
Methods, "Data analysis":
Rate of SIV acquisition after each challenge was determined using Kaplan–Meier plots and vaccine efficacy (VE) after the 9th IR challenge was determined using the formula VE = 1 – [(infection rate among vaccinated animals)/(infection rate among control animals)] × 100 and followed by Fisher’s exact test as described by Klasse et al.101.
A P < 0.05 was considered significant.
Figure 2 legend, panel (a):
(a) Study design and percentage of uninfected animals after repeated low dose intrarectal challenge with SIVmac251 in tonsil vaccinated (n = 6) and control (n = 6) groups. Statistical analysis was performed using one-tailed Fishers Exact Test as described in ref. 101 and a P < 0.05 (*) was considered significant.
Figure 2a, Kaplan–Meier panel (text printed inside the plot, read from the published figure image):
VE = 43% P = <0.0001
Methods, "Animals, vaccination, infection, and samples" (group sizes):
(unvaccinated control; n = 6 and vaccinated; n = 7)
Abstract:
43% (3/7) of vaccinated macaques remained uninfected after 9 challenges as compared to the unvaccinated control (0/6) animals.
Introduction, last paragraph:
Our results demonstrated a significant level of protection from acquisition
What the paper's own numbers show
Method. At the 9th challenge the paper's counts form a 2×2 table: vaccinated, 3 uninfected and 4 infected (n = 7); control, 0 uninfected and 6 infected (n = 6). Fisher's exact test conditions on the margins: 3 uninfected animals out of 13, 7 of them vaccinated. The one-tailed p-value in the direction of protection is the probability that all 3 uninfected animals fall in the vaccinated group if vaccination had no effect, which is C(7,3)/C(13,3) = 35/286. The full null distribution of the number of uninfected animals in the vaccinated group (0, 1, 2 or 3 of 3) is 20/286, 105/286, 126/286 and 35/286. The two-tailed p adds the 0-of-3 tail, giving (35 + 20)/286. For the lower bound, the most extreme possible result (all 7 vaccinated uninfected, all 6 controls infected) has one-tailed p = 1/C(13,7) = 1/1716. Its two-tailed p is also 1/1716, because the only opposite-tail table (just 1 of the 7 uninfected animals in the vaccinated group) has probability 7/1716 and is therefore not added. A search over every 7-vs-6 table gives the same minimum two-tailed Fisher p. Unconditional exact tests do not condition on the margins and have a lower floor here: for the most extreme table, Barnard's and Boschloo's tests both give (7/13)⁷(6/13)⁶ = 1.27 × 10⁻⁴. The Kaplan–Meier curves in Fig. 2a show when each animal became infected, which allows a log-rank (Mantel–Cox) test. Read from the published figure, approximately: controls step from 100% to 83%, 67%, 33%, 17% and 0% at challenges 1, 2, 4 (two animals), 7 and 9. Vaccinated animals step from 100% to 57% at challenge 2 (three animals) and to 43% at challenge 4, and three remain uninfected. The Fisher values were computed with scipy.stats.fisher_exact and checked against the closed-form binomial ratios, the unconditional values with scipy.stats.barnard_exact and boschloo_exact, and the log-rank values with the standard Mantel–Cox formula, all in recompute.py.txt. To find the log-rank floor, the script also enumerates all 57,257,200 possible outcomes, with each animal infected at one of challenges 1 to 9 or uninfected after the 9th.
| Quantity | Location | Reported | Recomputed |
|---|---|---|---|
| Vaccine efficacy, 1 − (4/7)/(6/6) | Results; Abstract | 43% | 42.9% (consistent) |
| p-value for the 9th-challenge acquisition comparison | Results, first acquisition paragraph | P < 0.0001 | 0.122 with the stated test |
| One-tailed Fisher exact, 3/7 vs 0/6 uninfected | Test named in Methods and Fig. 2a legend | (not given separately) | 35/286 = 0.1224 |
| Two-tailed Fisher exact, 3/7 vs 0/6 | Same table | — | 55/286 = 0.1923 |
| One-tailed Fisher exact if n = 6 vaccinated, 3/6 vs 0/6 | Fig. 2a legend states n = 6 | — | 20/220 = 0.0909 (two-tailed 0.1818) |
| Smallest attainable Fisher or permutation p, 7 vs 6 animals | Lower bound for conditional exact tests of this design | — | one-tailed 1/1716 = 5.83 × 10⁻⁴; two-tailed also 1/1716 = 5.83 × 10⁻⁴ |
| Smallest attainable Barnard or Boschloo p, 7 vs 6 animals | Lower bound for unconditional exact tests of this design | — | (7/13)⁷(6/13)⁶ = 1.27 × 10⁻⁴ (still above 1 × 10⁻⁴) |
| Barnard exact, 3/7 vs 0/6 | Same table | — | one-sided 0.106 (two-sided 0.106) |
| Boschloo exact, 3/7 vs 0/6 | Same table | — | one-sided 0.054 (two-sided 0.108) |
| Log-rank (Mantel–Cox), Fig. 2a curves as read | Fig. 2a Kaplan–Meier panel (approximate readings) | — | χ² = 1.55, p = 0.21 (one-sided 0.11); χ² = 1.07, p = 0.30 if the first vaccinated step is read at challenge 1 |
| Largest log-rank χ² over every possible 7-vs-6 outcome | Lower bound for the large-sample log-rank test | — | χ² = 14.14, two-sided p = 1.7 × 10⁻⁴ |
| Fewest uninfected vaccinated animals (of 7, vs 0/6) needed for one-tailed p < 0.05 | Same test | — | 4 of 7 (p = 0.0490) |
| Ratio of recomputed p to reported bound | — | — | 0.1224 / 0.0001 ≈ 1,224 |
Figure
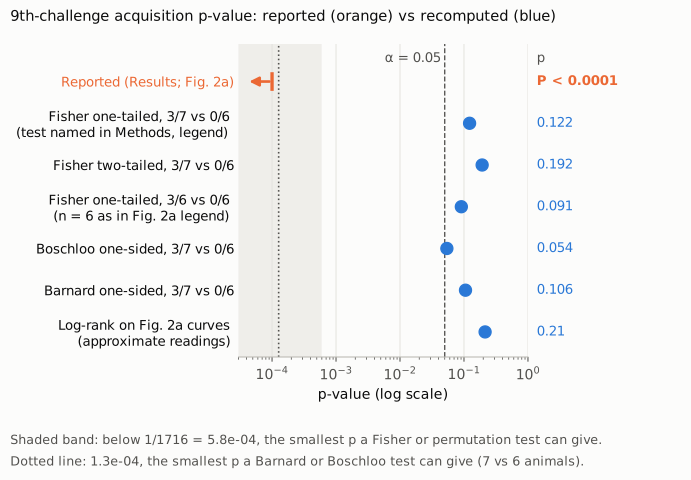
Figure 1. The p-value reported for the 9th-challenge acquisition comparison in the Results and the Fig. 2a panel (orange, "P < 0.0001", drawn as an upper bound with an arrow) and p-values recomputed from the paper's own counts and curves (blue), all on a single log-scaled axis. The dashed line marks the paper's significance threshold, α = 0.05. The one-tailed Fisher exact test named in the Methods and the Fig. 2a legend gives 0.122 for 3/7 vs 0/6 uninfected. The two-tailed version gives 0.192. If the vaccinated group had the n = 6 stated in the Fig. 2a legend, the one-tailed value is 0.091. The unconditional exact tests give one-sided 0.054 (Boschloo) and 0.106 (Barnard). A log-rank test on the Fig. 2a curves, as read approximately, gives 0.21. The shaded band marks values below 1/1716 = 5.8 × 10⁻⁴, the smallest p a Fisher or permutation test can give with 7 vs 6 animals. The dotted line marks 1.3 × 10⁻⁴, the smallest p a Barnard or Boschloo test can give. The reported bound lies below both.
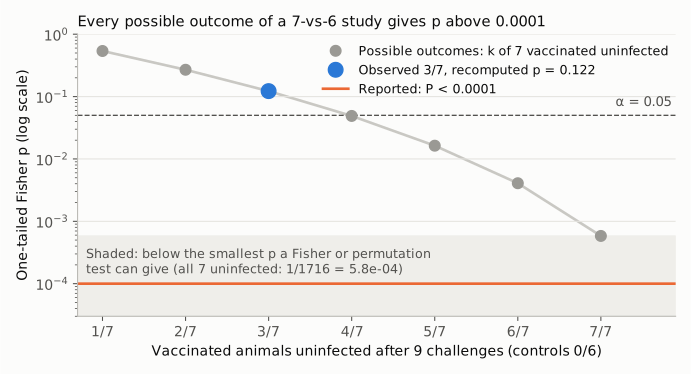
Figure 2. One-tailed Fisher exact p-values for every possible outcome of the 9th-challenge comparison with 0/6 controls uninfected, as the number of uninfected vaccinated animals runs from 1/7 to 7/7 (gray). The observed 3/7 is shown in blue (p = 0.122). Even the most extreme outcome, all seven vaccinated animals uninfected, gives p = 1/1716 = 5.8 × 10⁻⁴. That value is above the reported "P < 0.0001" (orange line). The design would have needed at least 4 of 7 vaccinated animals uninfected to reach p < 0.05.
Why it matters
The 9th-challenge acquisition comparison is the paper's primary efficacy result. The paper's title says the vaccine "protects macaques", the Introduction describes "a significant level of protection from acquisition", and the Abstract presents the 3/7 vs 0/6 comparison as its main finding. "P < 0.0001" is the only p-value the paper gives for this comparison (Results text and Fig. 2a panel). Recomputed with the stated test, the comparison does not reach the paper's own α of 0.05 (one-tailed p = 0.122). A reader would therefore take a result in 13 animals that does not reach significance to be highly significant.
Some parts of the paper are not affected. The VE point estimate (42.9%, reported as 43%) and the descriptive counts are internally consistent, and so is the report that one vaccinated animal stayed uninfected through 22 challenges. The separate analyses of acute viremia, CD4 counts, cytokines and immune correlates use other tests and other data and are not addressed here. The point concerns only the inferential support for protection from acquisition.
Explanations considered
- A different test, such as a log-rank test on the Kaplan–Meier curves. The Methods say Kaplan–Meier plots were used for the rate of acquisition. However, the reported P is attached to the VE at the 9th challenge, and both the Methods and the Fig. 2a legend name Fisher's exact test for that comparison. The paper does not report a log-rank or Mantel–Cox test anywhere. The infection times can be read approximately from the Fig. 2a curves: controls infected at challenges 1, 2, 4, 4, 7 and 9; vaccinated animals infected at challenge 2 (three animals) and 4 (one animal), with three uninfected. A log-rank test on these readings gives χ² = 1.55, p = 0.21. If the first vaccinated step is read at challenge 1 instead, χ² = 1.07, p = 0.30. Neither reading comes close to 0.05. Across every possible outcome with 7 vs 6 animals, the large-sample log-rank χ² cannot exceed 14.14, so its two-sided p cannot go below 1.7 × 10⁻⁴. A one-sided version reaches below 1 × 10⁻⁴ only when all six controls are infected before any vaccinated animal (smallest value 8.5 × 10⁻⁵), which is far from the curves in Fig. 2a, where three vaccinated animals were infected when only two controls had been. An exact (permutation) version of the test cannot go below 1/1716 = 5.8 × 10⁻⁴. This explanation does not account for the reported number.
- An unconditional exact test (Barnard or Boschloo). These tests do not fix the table margins, and on 7 vs 6 animals they can reach lower values than Fisher's test, down to (7/13)⁷(6/13)⁶ = 1.27 × 10⁻⁴, which is still above 1 × 10⁻⁴. On the observed 3/7 vs 0/6 they give one-sided p = 0.106 (Barnard) and 0.054 (Boschloo). Neither is below 0.05. This explanation does not account for the number.
- Group size of 6 rather than 7. The Fig. 2a legend gives "tonsil vaccinated (n = 6)", while the Methods, Results and Abstract give 7. The post-infection panels and legends (Figs. 2b–e, 3–5, 7 and 8) also give "tonsil vaccinated (n = 6)", which matches the six vaccinated animals that eventually became infected. Before challenge, the ELISPOT legend (Fig. 6) gives n = 7, and the anti-MVA antibody panel (Fig. 1c) gives n = 6. Fig. 2a covers acquisition in all 7 vaccinated animals but carries the same n = 6 label as the post-infection panels. Even taken at face value, 3/6 vs 0/6 gives a one-tailed Fisher p of 0.091 (two-tailed 0.182). This is still not significant at 0.05 and is roughly 900 times the reported bound. This explanation does not account for the number.
- One-tailed vs two-tailed. Both were computed: 0.122 and 0.192. Neither is close to 0.0001. This explanation does not account for the number.
- Per-exposure analysis (Klasse et al.). The cited reference discusses estimating efficacy per exposure in repeated low-dose challenge studies. The paper, however, defines VE at the 9th challenge with a per-animal formula and reports 43%, which reproduces exactly from the per-animal counts. A per-exposure analysis would give a different VE than the one reported. The paper does not describe such an analysis or report its result, so it cannot be verified as the source of the p-value.
- Typographical slip, for example a misplaced decimal. No obvious single-character change links the recomputed 0.122 to "< 0.0001". The paper prints "P < 0.0001" as an inequality, which is the form statistical software uses for very small values. The source of the reported value cannot be determined from the paper.
- Conversion or rendering artifact. The sentence reads identically in the PMC archive, the Europe PMC full-text XML supplied by the publisher, and the PMC public page. This explanation is ruled out.
Status
- Version of record. The statement appears verbatim in the PubMed Central and Europe PMC archives of the published article. The DOI resolves to the publisher's article page, which redirected to an authentication page and could not be fetched directly. The archived full text is the publisher's version of record.
- Supplements. The Supplementary Information PDF (supplementary figures and captions) and the Reporting Summary are listed with the article. The Supplementary Information was read in full. It contains no statistical test for the acquisition comparison and no occurrence of "0.0001", "Fisher", "log-rank", "Mantel" or "Kaplan". No separate source-data file is linked on PMC. The supplement does not resolve the discrepancy.
- Figure 2a. The Kaplan–Meier panel was checked in the publisher's figure image. It prints "VE = 43%" and "P = <0.0001" and shows the step pattern used for the log-rank readings above.
- Corrections. No correction, erratum, retraction, expression of concern or editor's note was found in Crossref (no update-to or updated-by relations), PMC notices, or Europe PMC (no comment or correction links).
- PubPeer. PubPeer could not be queried directly (HTTP 403). A web search for the DOI and title on PubPeer and Retraction Watch found no thread or notice.
- Sources: PMC9990026; Europe PMC record PMID 36882405; api.crossref.org/works/10.1038/s41467-023-36907-0. Checked as of 2026-10-23.
Suggested correction
The authors should report the p-value for the 9th-challenge acquisition comparison that the stated method gives for the stated counts: a one-tailed Fisher's exact test of 3/7 vs 0/6 uninfected, p = 0.12 (two-tailed p = 0.19). They should state that this comparison is not significant at the paper's α of 0.05. If a different analysis produced the reported value, they should name that test, report the per-animal infection times it used, and confirm that the value is valid for 13 animals. Wording that rests on this comparison should be revised to match, specifically "significant level of protection from acquisition" in the Introduction and the claim that the vaccine "protects" in the title and Abstract. The group size in the Fig. 2a legend (n = 6 vaccinated) should be reconciled with n = 7 in the Methods, Results and Abstract. The post-infection panels use n = 6, which matches the six vaccinated animals eventually infected, but Fig. 2a covers acquisition in all 7.