← Back to the plain-language case
Abstract attributes the all-EGFR c-Met-high response rate (10/19, 52.6%) to the EGFR-mutant subgroup (n = 15)
J Clin Oncol (2022) · doi:10.1200/JCO.22.00739 · PMC9928626
Summary
The abstract reports that EGFR-mutation-positive (EGFR-M+) patients with c-Met-high tumors (H-score ≥ 225; n = 15) had an objective response rate (ORR) of 52.6%. No whole number of responders out of 15 gives 52.6% (7/15 = 46.7%, 8/15 = 53.3%). The figure is exactly 10/19, which the Results give as the ORR for all 19 c-Met-high patients, a group that includes three EGFR wild-type responders. The Results' own breakdown puts 7 responders among the 15 EGFR-M+ c-Met-high patients, an ORR of 46.7% (exact 95% CI 21.3 to 73.4). This is the abstract's only efficacy estimate for the subgroup the paper presents as of greatest clinical interest, and it overstates that estimate by 5.9 percentage points.
What the paper reports
Abstract, Results:
ORR for EGFR-M+ patients (n = 28) was 32.1%. Of EGFR-M+ patients, those who were c-Met high (n = 15) had an ORR of 52.6%.
Results, Efficacy, fourth paragraph (the paragraph describing Figure 2):
Among patients with c-Met–high scores (n = 19), one achieved a CR (1/19; 5.3%; EGFR-M+), nine achieved a PR (9/19; 47.4%; six EGFR-M+ and three EGFR-WT), five had SD (5/19; 26.3%; EGFR-M+), and four experienced progressive disease (4/19; 21.1%; three EGFR-M+ and one rare/unknown EGFR), indicating an ORR of 52.6% and DCR of 78.9%. No patients with lower c-Met scores achieved a CR; two of 16 had a PR (12.5%), 12 had SD (75%), and two had progressive disease (12.5%), indicating an ORR of 12.5% and DCR of 87.5%.
Results, Efficacy, second and third paragraphs:
For EGFR-M+ patients (n = 28), ORR was 32.1% (9/28; 95% CI, 15.9 to 52.4), with one CR (3.6%) and eight PR (28.6%).
ORR in EGFR-WT patients (n = 5) was 40% (2/5; two PR) and DCR was 80% (4/5; two PR and two SD). All three patients with rare/unknown EGFR mutations achieved SD.
Patients and Methods, Assessments, Efficacy:
ORR was defined as the proportion of patients with confirmed complete response (CR) or partial response (PR).
Results, Patient Characteristics:
Importantly, 53% were c-Met high (H-score ≥ 225).
Figure 2 legend:
HI indicates c-Met high (≥ 225; n = 19).
Context box, Relevance:
The subsets of greatest clinical interest are the patients with EGFR-M+ NSCLC who progressed on a prior EGFR TKI, and with high c-Met H-scores by immunohistochemistry.
Discussion, first paragraph:
This combination also showed promising efficacy, especially in c-Met–high EGFR-M+ patients, in agreement with each drug's mechanism of action.
What the paper's own numbers show
Method. I checked which response counts out of 15 could produce the abstract's 52.6%, and which denominators up to 40 could produce it at all. I then rebuilt the c-Met-high group from the Results breakdown by EGFR group and computed the ORR of its EGFR-M+ column, with the exact (Clopper-Pearson) interval the paper says it uses. As a check, I recomputed every ORR and disease control rate (DCR) in Table 3 and Table 4 from their printed counts, and tallied the per-patient labels in Figure 2 (EGFR group colour, c-Met ≥ 225 hatching, MET-amplification asterisk and best response, transcribed by eye). Every number below is printed by recompute.py.txt.
| Quantity | Location | Reported | Recomputed from the paper's own numbers |
|---|---|---|---|
| ORR, EGFR-M+ and c-Met high (n = 15) | Abstract, Results | 52.6% | 7/15 = 46.7% (exact 95% CI 21.3 to 73.4); 1 CR + 6 PR from the Results breakdown |
| Possible ORRs with n = 15 | (derived) | — | 7/15 = 46.7%, 8/15 = 53.3%; none rounds to 52.6% (52.6% × 15 = 7.89) |
| Fractions with denominator ≤ 40 that give 52.6% | (derived) | — | 10/19 and 20/38 only |
| ORR, all c-Met high (n = 19) | Results, Efficacy p4 | 52.6% | (1 + 9)/19 = 52.6% (CI 28.9 to 75.6); matches |
| DCR, all c-Met high | Results, Efficacy p4 | 78.9% | 15/19 = 78.9%; matches |
| Size of the EGFR-M+ c-Met-high group | Results, Efficacy p4 | n = 15 (Abstract) | 1 CR + 6 PR + 5 SD + 3 PD = 15; matches the abstract's n |
| DCR, EGFR-M+ and c-Met high | (derived) | not reported | 12/15 = 80.0% |
| Responders in the c-Met-high group who are not EGFR-M+ | Results, Efficacy p4 | three EGFR-WT PR | 10 − 7 = 3 |
| Upper limit for the EGFR-M+ c-Met-high ORR | Table 3 (9 EGFR-M+ responders in all) | — | 9/15 = 60.0%, if every EGFR-M+ responder were c-Met high |
| EGFR-M+ c-Met-high responders in Figure 2 | Figure 2 labels | — | 1 CR + 6 PR = 7 among 14 plotted (7/14 = 50.0%) |
| ORR, c-Met lower (n = 16) | Results, Efficacy p4 | 12.5% | 2/16 = 12.5% (CI 1.6 to 38.3); matches |
| c-Met-high share of efficacy set | Patient Characteristics | 53% | 19/36 = 52.8%; matches |
| ORR / DCR, EGFR-M+ (n = 28) | Table 3; Results p2 | 32.1% [15.9 to 52.4] / 85.7% [67.3 to 96.0] | 9/28 and 24/28; same values and CIs |
| ORR / DCR, EGFR-WT (n = 5) | Table 3 | 40.0% [5.3 to 85.3] / 80.0% [28.4 to 99.5] | 2/5 and 4/5; same values and CIs |
| ORR / DCR, rare/unknown (n = 3) | Table 3 | 0 [0.0 to 70.8] / 100 [29.2 to 100] | 0/3 and 3/3; same values and CIs |
| ORR / DCR, total (n = 36) | Table 3; Results p1 | 30.6% [16.3 to 48.1] / 86.1% [70.5 to 95.3] | 11/36 and 31/36; same values and CIs |
| Table 4 subgroup ORR / DCR | Table 4; Results p2-p3 | 31/77, 33/93, 27/73, 39/100 | 4/13, 10/13; 5/15, 14/15; 4/15, 11/15; 5/13, 13/13; all match |
All of the paper's other response rates reproduce from their printed counts, including every Clopper-Pearson interval in Table 3. The abstract's 52.6% is the only one that cannot be formed from its stated denominator. Its digits equal the all-EGFR c-Met-high rate (10/19) given in the Results, and the 15 is the size of the EGFR-M+ column of that same breakdown. The abstract thus pairs the n = 19 rate with the n = 15 label.
The figure for the EGFR-M+ c-Met-high subgroup does not depend on whether responses were confirmed. Table 3 (confirmed responses) and Figure 2 (best response) both show 9 EGFR-M+ responders in the whole cohort (1 CR, 8 PR). Seven of them carry the c-Met ≥ 225 hatching in Figure 2, the same 7 the Results paragraph lists.
Figure
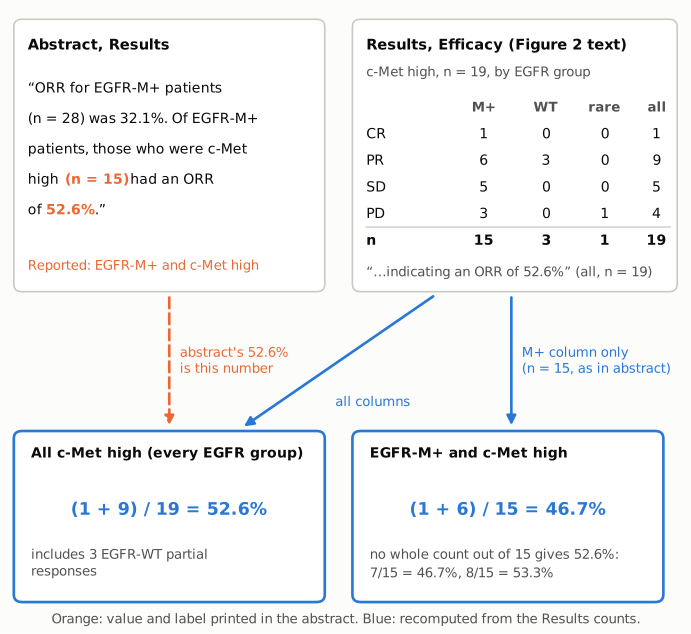
Figure 1. Where the abstract's number comes from. Top left: the abstract sentence, with the value and the subgroup size it states in orange. Top right: the Results breakdown of the 19 c-Met-high patients by best response and EGFR group (counts as printed in the text). Bottom: the two response rates that breakdown supports, in blue. Pooling all columns gives (1 + 9)/19 = 52.6%, the value the Results report for all c-Met-high patients and the value the abstract prints. Using only the EGFR-M+ column, the group of 15 the abstract names, gives (1 + 6)/15 = 46.7%. No count out of 15 can give 52.6%.
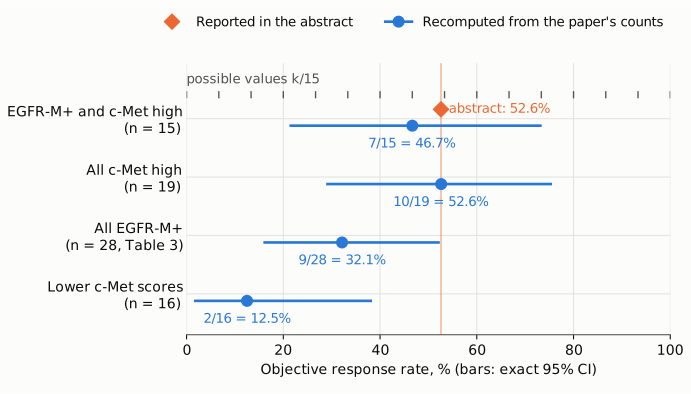
Figure 2. Objective response rates on one axis, with exact 95% CIs. Blue dots and bars are recomputed from the paper's counts; the orange diamond is the value the abstract reports for EGFR-M+, c-Met-high patients. The grey ticks above the first row mark every rate that 15 patients can produce (k/15); 52.6% falls between 7/15 and 8/15. The thin orange line at 52.6% passes through the all-c-Met-high estimate (10/19), not the EGFR-M+ one. The correction moves the subgroup estimate down by 5.9 points. It remains well above the rate in patients with lower c-Met scores (2/16) and above the rate in all EGFR-M+ patients (9/28), with wide, overlapping intervals.
Why it matters
- It is the abstract's headline estimate for the paper's focal subgroup. The Context box names EGFR-M+ patients with high c-Met H-scores as "the subsets of greatest clinical interest", and the Discussion says the combination "showed promising efficacy, especially in c-Met–high EGFR-M+ patients". The abstract gives one number for that subgroup, 52.6%, which reads as "more than half respond". The paper's own counts give 7 of 15, 46.7%, which is "slightly under half".
- The number has been repeated as stated. A trade-press report of the paper (OncLive) gives "For c-MET high, EGFR-mutated patients (n = 15), the ORR was 52.6%." Readers who rely on the abstract or on secondary summaries get a subgroup estimate that is 5.9 points too high.
- The direction of the finding is unchanged. At 46.7%, EGFR-M+ c-Met-high patients still respond more often than all EGFR-M+ patients (32.1%) and much more often than patients with lower c-Met scores (12.5%). No formal test in the paper uses the 52.6%, and the abstract's conclusion of "encouraging antitumor activity and acceptable toxicity" does not depend on it. With n = 15 the interval is wide either way (21.3 to 73.4 for 7/15).
- The c-Met-stratified counts do not fully reconcile with the confirmed-response tables, so the confirmed subgroup rate may differ again. The c-Met paragraph totals 19 + 16 = 35 patients and 10 + 2 = 12 responders, against 36 patients and 11 confirmed responders in Table 3. It lists three EGFR-WT PRs among c-Met-high patients, while Table 3 has two EGFR-WT PRs in total, and one rare/unknown-EGFR patient with progressive disease, while Table 3 and the text say all three such patients had SD. Figure 2 shows the same pattern (35 patients plotted; 12 best-response CR or PR; three EGFR-WT PRs; one rare/unknown PD), so the paragraph appears to describe best responses in Figure 2 rather than confirmed responses. These differences involve EGFR-WT and rare/unknown patients and leave the EGFR-M+ c-Met-high responder count at 7. The size of that group is 15 in the text and 14 among the plotted patients (7/14 = 50.0%). Neither gives 52.6%.
Explanations considered
- The abstract meant all c-Met-high patients (n = 19). This accounts for the 52.6% exactly: (1 + 9)/19 = 52.63%. It does not fit the wording or the n. The sentence begins "Of EGFR-M+ patients" and gives n = 15, which is the EGFR-M+ count of the c-Met-high group in the Results (1 + 6 + 5 + 3). It cannot be n = 19 EGFR-M+ patients, because 4 of the 19 c-Met-high patients are EGFR-WT or rare/unknown.
- A different response definition (confirmed versus best response). Not able to explain it. Under either definition the EGFR-M+ responders number 9 in the whole cohort and 7 among the c-Met-high patients (Table 3; Figure 2; Results paragraph). And whatever the count, no integer out of 15 gives 52.6%.
- A different denominator, such as patients with a measurable target lesion. Not able to explain it. A rate of 52.6% to one decimal place needs a denominator of 19 or 38 (for n ≤ 40). The EGFR-M+ c-Met-high group has 15 patients in the text and 14 in Figure 2; neither number, nor any subset of it, can give 52.6%.
- Rounding. Ruled out. The nearest attainable values are 46.7% and 53.3%. Even 8/15 would be printed as 53.3%, and it would need a responder the Results paragraph and Figure 2 do not show.
- A text-conversion artifact. Ruled out. The same sentence, with n = 15 and 52.6%, appears in the PMC-archived text, the Europe PMC full-text XML and the PubMed abstract (PMID 36288547). The Results numbers come from running text, not from a converted table.
- A correction already issued. None found (see Status).
- Side observations, not part of the main finding. (1) The Discussion gives the ORR of the MET-amplified subset (n = 6) as 62.5%, which no count out of 6 can produce (3/6 = 50.0%, 4/6 = 66.7%; 62.5% is 5/8 or 10/16). Figure 2 marks six MET-amplified patients, of whom three had a PR, which is 3/6 = 50.0%. (2) The Results say that of the five MET-amplified c-Met-high patients "two had SD (50%)"; 2/5 = 40%. (3) The c-Met-stratified paragraph and Table 3 differ as described under "Why it matters". None of these affects the paper's conclusions.
Status
- Version of record. The publisher's page (ascopubs.org, reached through doi.org) returned HTTP 403 to automated requests. I checked three other copies of the published text: the PMC-archived article (as published in J Clin Oncol 2023;41(5):1105-1115, first published online in 2022), the Europe PMC full-text XML and the PubMed record (PMID 36288547). All three have the abstract sentence quoted above, with "(n = 15)" and "52.6%", and the same Results paragraph. Every quotation was checked verbatim against the PMC-archived text with
src/show.py. Tables 3 and 4 and Figure 2 are images in the archived article. I read them from the publisher's graphics in the Europe PMC supplementary package (jco-41-1105-g003, g005, g006). - Supplements. The Europe PMC supplementary package contains only the article's figure and table images. The online-only JCO Data Supplement (methods, pharmacokinetics, adverse events and time to response, per the text) was not reachable (HTTP 403) and is not hosted by PMC or Europe PMC. The question is settled by the article itself: the Results breakdown, Table 3 and Figure 2 agree that 7 EGFR-M+ c-Met-high patients responded.
- Corrections and comments. As of 2026-10-24 I found no correction, erratum, retraction or expression of concern.
src/known.pyreturns no Crossref update relations, no PMC notices and no Europe PMC notices. The Crossref record has empty update-to and updated-by fields. The PubMed record's only CommentsCorrections entry is a "CommentIn" link to an editorial commentary. The PubPeer API returned no record (HTTP 404) for the DOI, and web searches for the title with "PubPeer", "erratum" or "correction" found no thread or notice. - Sources. PMC article PMC9928626; Europe PMC full-text XML and supplementary files for PMC9928626; PubMed (PMID 36288547); Crossref; PubPeer; OncLive, "Telisotuzumab Vedotin Plus Erlotinib Shows Encouraging Activity in Advanced c-Met+ NSCLC"; https://doi.org/10.1200/JCO.22.00739.
Suggested correction
In the abstract, replace
Of EGFR-M+ patients, those who were c-Met high (n = 15) had an ORR of 52.6%.
with
Of EGFR-M+ patients, those who were c-Met high (n = 15) had an ORR of 46.7% (7/15).
if the Results breakdown counts confirmed responses, or with the confirmed count out of 15 if it does not. Alternatively, keep 52.6% and describe it correctly: "Patients who were c-Met high (n = 19), regardless of EGFR status, had an ORR of 52.6%." The authors may also wish to say whether the c-Met-stratified paragraph of the Results reports best or confirmed responses, and to reconcile it with Table 3 (35 v 36 patients; 12 v 11 responders; EGFR-WT and rare/unknown counts). In the Discussion, they may wish to check the MET-amplified ORR of 62.5% against the six MET-amplified patients in Figure 2 (3/6 = 50.0%), and in the Results the "two had SD (50%)" of five patients (2/5 = 40%).