← Back to the plain-language case
Abstract reports 15.4% survival before 24 weeks; the paper's own counts give 24.1%
Lancet Reg Health Am (2022) · doi:10.1016/j.lana.2022.100330 · PMC9903864
Summary
The abstract gives survival to discharge or transfer for US infants born before 24 weeks' gestation in 2007–2018 (N = 77,050) as 15.4%. The Results and Discussion give the same quantity for the same group as 18,533 survivors (24.1%), and 18,533 / 77,050 = 24.05%. That count is supported three more ways inside the paper: the reported deaths, the Table 1 subgroup rows (by sex, race, payer and birth weight, each summing to about 18,533 survivors) and the yearly trend, whose values average about 24%. No count, denominator or subgroup in the paper produces 15.4%. The paper presents these rates as a national benchmark for prenatal counselling, so a reader of the abstract alone would understate survival in this group by 8.7 percentage points (36% in relative terms). None of the paper's trend or regression results depend on the abstract figure.
What the paper reports
Survival rates for infants <24 weeks and with completed 24 weeks were 15.4% and 71.6%, respectively
— Abstract, Findings
In the group of infants with GA <24 weeks (N = 77,050), only 18,533 (24.1%) survived
— Results, 2nd paragraph (the same sentence goes on: "in infants born with completed 24 weeks of gestation (n = 47,295), a total of 33,872 (71.6%) survived")
mortality among all periviable infants was 71,940 (57.86%)
— Results, 1st paragraph (periviable infants: 124,345, "of those, 77,050 infants were born <24 weeks, and 47,295 were born at 24 weeks of gestation")
The study presented the national survival of 24.1% and 71.6% for preterm infants with GA <24 weeks and completed 24 weeks, respectively
— Discussion, 1st paragraph
The majority (71.6%) of infants born with GA of 24 weeks survived, whereas only 24.1% of infants <24 weeks survived
— Discussion, 2nd paragraph
In infants with GA <24 weeks, survival started at 18.4% in 2007 and was 31.9% by the year 2018
— Results, trend paragraph (also in Research in context: "survival of infants born at GA <24 weeks increased from 18.4% to 31.9%")
Female | 34,939 | 9124 (26.1) Male | 41,768 | 9409 (22.5)
— Table 1, Gender rows, columns for GA <24 weeks (Total | Alive (%)). The footer says "All numbers represent weighted data."
This study provides national benchmarks that can be used during prenatal counselling
— Conclusions
What the paper's own numbers show
Method. I took the counts the paper reports for infants born before 24 weeks (total, survivors, deaths across all periviable infants, and every Table 1 subgroup row) and recomputed the survival percentage in each way the paper's numbers allow. I then looked for any count, denominator or subgroup that would produce 15.4%. As a check against the trend, I read the yearly values off the paper's Figure 1 (upper panel, dotted line) by pixel digitization. This was calibrated on the axis labels and matches the two stated endpoints within 0.2 points. All numbers below are printed by recompute.py.txt.
| Quantity | Location | Reported | Recomputed |
|---|---|---|---|
| Survival, GA <24 wk, 2007–2018 | Abstract, Findings | 15.4% | 18,533 / 77,050 = 24.05% |
| Survival, GA <24 wk, 2007–2018 | Results 2nd para; Discussion 1st and 2nd paras | 18,533 (24.1%) | 24.05% (agrees) |
| Survival, completed 24 wk | Abstract; Results; Discussion | 33,872 / 47,295 (71.6%) | 71.62% (agrees in all places) |
| Group sizes | Abstract; Results 1st para | 77,050 + 47,295; total 124,345 | 77,050 + 47,295 = 124,345 (agrees) |
| Mortality, all periviable | Results 1st para | 71,940 (57.86%) | 71,940 / 124,345 = 57.86%. Survivors 124,345 − 71,940 = 52,405 = 18,533 + 33,872 exactly, so 52,405 − 33,872 = 18,533 survivors <24 wk (24.05%) |
| Table 1 <24 wk survivors, rows summed | Table 1 | subgroup counts | sex 18,533 / 76,707 = 24.16%; race 18,535 / 77,050 = 24.06%; payer 18,533 / 77,051 = 24.05%; birth weight 18,534 / 77,051 = 24.05%; income 18,202 / 75,830 = 24.00% |
| Survivors needed for 15.4% | derived | — | 0.154 × 77,050 = 11,866 (11,827–11,904 round to 15.4%); no such count appears in the paper |
| Alternative denominator | derived | — | 18,533 / 124,345 (all ≤24 wk) = 14.90%, not 15.4%; 18,533 would need a denominator of 120,344 |
| Ratio of 24-wk to <24-wk survival | Abstract vs data | 71.6 / 15.4 = 4.65-fold | 71.62 / 24.05 = 2.98-fold |
| Yearly survival, <24 wk | Research in context; Results trend para; Discussion | 18.4% (2007) to 31.9% (2018) | Figure 1 reading (approx.): 18.2, 14.5, 21.0, 20.4, 21.0, 24.6, 24.6, 26.2, 28.7, 29.7, 30.3, 32.0; unweighted mean 24.27% |
| Pooled 15.4% vs yearly values | derived | — | Only 2008 (≈14.5%) lies below 15.4%. A pooled 15.4% would need at least (18.2 − 15.4) / (18.2 − 14.5) = 76% of the 12-year cohort to fall in 2008 |
Other inconsistencies noted in passing (not part of the main finding, and not needed for it):
| Quantity | Location | Reported | Recomputed |
|---|---|---|---|
| Survival by sex, completed 24 wk | Table 1 vs Results 2nd para, Abstract and Figure 1 lower panel | Female 17,635 / 25,480 (69.2); Male 16,213 / 21,766 (74.5); the text says "Survival among males was lower than females in infants <24 weeks (p < 0.001) and completed 24 weeks (p < 0.001)" | 69.2% and 74.5%: the counts and percentages agree, but they show higher crude survival in males, the opposite of the text |
| Survival by birth weight, completed 24 wk | Table 1 vs Results (four-group percentages 45.1% for ≤500 g and 73.8% for >500 g) | ≤500 g: 43,772 / 32,283 (45.1); >500 g: 3,523 / 1,590 (73.8) | 32,283 / 43,772 = 73.8% and 1,590 / 3,523 = 45.1%: each row's counts give the other row's printed percentage |
| Median length of stay, survivors | Results vs Table 2 | text 113 and 114 days; Table 2 118 and 110 days | not reconcilable from the reported numbers |
| Median charges, survivors | Results vs Table 2 (and Discussion) | text $1,050,953 and $1,016,751; Table 2 (and Discussion) $926,105 and $895,137 | not reconcilable from the reported numbers |
Figure
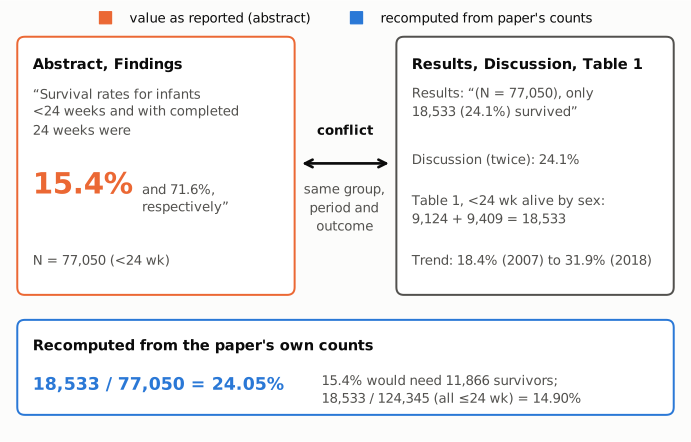
Figure 1. The contradiction in the paper's own text. Left: the abstract sentence, with the value at issue (15.4%, orange, as reported). Right: the same quantity elsewhere in the paper: the Results count of 18,533 survivors out of 77,050 (24.1%), the two Discussion statements of 24.1%, the Table 1 survivors by sex (9,124 + 9,409 = 18,533) and the stated trend endpoints. The connector marks that both sides describe the same group (GA <24 weeks, N = 77,050), the same period (2007–2018) and the same outcome (survival to discharge or transfer). Bottom (blue, recomputed): 18,533 / 77,050 = 24.05%. For comparison, 15.4% would require 11,866 survivors, and the nearest alternative denominator (all 124,345 periviable infants) gives 14.90%, which does not round to 15.4%. Values come from the paper or from recompute.py.txt.
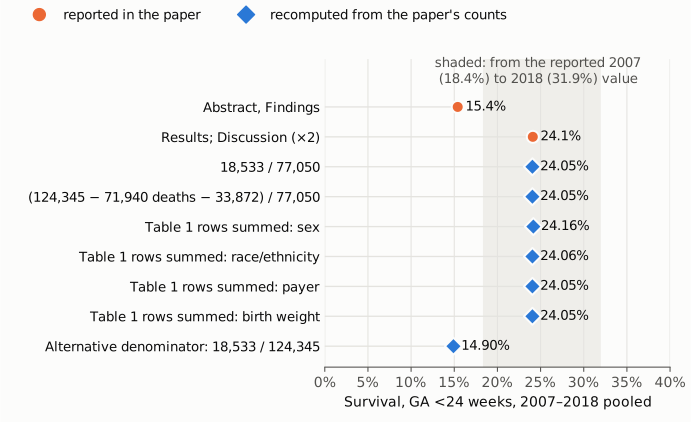
Figure 2. Survival before 24 weeks on one percentage axis starting at 0. Orange circles are values reported in the paper. Blue diamonds are values recomputed from the paper's own counts: the direct ratio, the route through the reported deaths, and the Table 1 subgroup rows summed by sex, race/ethnicity, payer and birth weight. Every route drawn lands between 24.05% and 24.16% (the income rows, which cover 75,830 of the 77,050 infants and are not drawn, give 24.00%), matching the 24.1% in the Results and Discussion. Only the abstract sits at 15.4%. The bottom row shows that the one plausible alternative denominator gives 14.90%, not 15.4%. The shaded band runs from the reported 2007 value (18.4%) to the reported 2018 value (31.9%). It marks the stated endpoints, not the full yearly range (the paper's Figure 1 shows a lower value, about 14.5%, in 2008). The yearly values themselves are not drawn.
Why it matters
- It is the abstract's headline outcome. The paper's primary outcome is survival, and its stated purpose is to supply "national benchmarks that can be used during prenatal counselling". The abstract figure for infants before 24 weeks is 8.7 percentage points (36% relative) below what the paper's data show: about 1 survivor in 6.5 births instead of 1 in 4.2.
- The abstract is the most widely read and indexed version. The PubMed record (PMID 36777383) carries the same sentence with 15.4%, and so do other abstract indexes. Readers who do not open the full text cannot see the 24.1% in the body.
- It changes the contrast the abstract draws. The abstract implies 24-week infants survive 4.65 times as often as infants under 24 weeks (71.6 / 15.4). The data give 2.98 times (71.62 / 24.05).
- What does not change. The 24-week figure (71.6%), the upward trends (Z = 9.438 and Z = 3.30), the adjusted odds ratios, the IVH and NEC trends and the cost analysis do not use the abstract figure. The paper's conclusions are worded qualitatively and stand as written. The issue is the size of the headline estimate in the abstract.
Explanations considered
- A different denominator. The abstract names the group explicitly ("infants <24 weeks", following "77,050 infants <24 weeks"). The only other natural denominator, all 124,345 periviable infants, gives 18,533 / 124,345 = 14.90%, which does not round to 15.4%. To get 15.4% from 18,533 survivors, the denominator would have to be 120,344, and that number does not appear in the paper. Does not account for the numbers.
- A different count of survivors (for example unweighted or from an earlier extract). The Methods say "This study used weighted data for all analyses", and the Table 1 footer says all numbers are weighted. 15.4% of 77,050 is 11,866 survivors. No count near that figure appears in the text or tables, and every Table 1 subgroup row, plus the deaths reported in the Results, adds up to about 18,533. Nothing in the paper supports this explanation.
- A subgroup, a single year or a sub-period. No Table 1 row for infants before 24 weeks prints a value from 15.0% to 15.9%. The nearest are the "other payer" group (14.7%) and the ≤500 g group (7.4%), and the abstract sentence refers to all infants under 24 weeks, not to a subgroup. In the paper's Figure 1, one year (2008, about 14.5%) lies below 15.4%. So a pooled 15.4% is not strictly impossible from the trend alone, as an initial screening of this paper assumed. It would, however, require at least 76% of the twelve-year cohort to be born in 2008, against an even spread of about 6,400 per year. The unweighted mean of the yearly values (24.27%) agrees with 24.1%.
- Adjusted or model-based estimate. The survival percentages in the abstract, Results and Table 1 are crude weighted proportions. The paper reports odds ratios, not adjusted survival rates. Its companion figure in the same abstract sentence (71.6%) is the crude proportion, matching 33,872 / 47,295.
- Digit transposition. "15.4" is not a rearrangement of "24.1", so a simple transposition does not explain it. The figure has no evident arithmetic origin in the paper.
- A rendering or conversion artefact. The value reads 15.4% in the archived PMC text, in the publisher-typeset PDF deposited in PMC, in the Europe PMC full-text XML and in the PubMed abstract. The body text reads 24.1% in all of them. This is not an artefact of one rendering.
None of these accounts for 15.4%. The paper's counts, its tables and its trend all support 24.1%.
Status
As of 2026-10-23:
- Version of record. The publisher pages (ScienceDirect, thelancet.com) returned HTTP 403 or a bot challenge, and the DOI resolves only to a redirect page. I checked the publisher-typeset PDF instead: the 8-page PDF served from the PMC article page (
pmc.ncbi.nlm.nih.gov/articles/PMC9903864/pdf/main.pdf, document metadata "Creator: Elsevier", "The Lancet Regional Health - Americas, 14 (2022) 100330"). It carries 15.4% in the abstract, 18,533 (24.1%) in the Results, 24.1% twice in the Discussion, and the same Table 1 and Table 2 values used here. The Europe PMC full-text XML and the PubMed record (PMID 36777383, E-utilities efetch) agree: the indexed abstract reads 15.4%. Every quote above was checked verbatim against the PMC-archived text withsrc/show.py, so this is not a conversion artefact. - Supplements. The Europe PMC supplementary bundle contains the images of Figures 1 and 2 and
mmc1.docx(Supplementary Table S1: ICD-9/ICD-10 codes only). There are no survival counts or source data, so nothing in the supplement resolves the discrepancy. I used the paper's Figure 1 only for the approximate yearly reading described above (the 2008 dip below 15% is visible on the image); it is not reproduced here. - Corrections and notices. On 2026-10-23,
src/known.pyreturned no Crossref updates, PMC notices or Europe PMC notices. The Crossref REST record has noupdate-to,updated-byorrelationentries, and the Crossref filterupdates:10.1016/j.lana.2022.100330returns 0 works. The Europe PMC record has no comment/correction list, and the PubMed record has no CommentsCorrections links. An earlier web search in this verification found no erratum; I could not repeat it in this step because the session's web search quota was used up. - PubPeer. The PubPeer search page and its extension API returned HTTP 403 (Cloudflare challenge), so PubPeer could not be checked directly. An earlier web search for the DOI on PubPeer found no thread.
- Sources. https://pmc.ncbi.nlm.nih.gov/articles/PMC9903864/ ; https://pubmed.ncbi.nlm.nih.gov/36777383/ ; https://api.crossref.org/works/10.1016/j.lana.2022.100330 ; Europe PMC REST (core search for PMID 36777383, full-text XML and supplementaryFiles for PMC9903864).
Suggested correction
In the Abstract, Findings, replace "Survival rates for infants <24 weeks and with completed 24 weeks were 15.4% and 71.6%, respectively" with "Survival rates for infants <24 weeks and with completed 24 weeks were 24.1% and 71.6%, respectively", consistent with 18,533 / 77,050 in the Results, Discussion and Table 1. The same correction should be passed to PubMed and other indexes. The authors may also wish to check:
- the Table 1 rows for completed 24 weeks by sex (69.2% female vs 74.5% male), which run opposite to the text, the abstract odds ratio and Figure 1;
- the Table 1 rows for completed 24 weeks by birth weight, where each row's counts match the other row's percentage (for example, 1,590 / 3,523 = 45.1%, the value the text gives for ≤500 g); and
- the medians for length of stay and charges in the Results text (113 and 114 days; $1,050,953 and $1,016,751), which differ from Table 2 (118 and 110 days; $926,105 and $895,137).