← Back to the plain-language case
Abstract reports a 13.2-point TIR gain for baseline GMI >8.0; Table 1 implies 22.3 points
Diabetes Care (2022) · doi:10.2337/dc22-1217 · PMC9862393
Summary
The abstract states that time in target range (TIR, 70–180 mg/dL) improved by 13.2 percentage points after the switch from predictive low glucose suspend (PLGS) to automated insulin delivery (AID) in people with baseline GMI >8.0 (N = 4,064). Table 1 gives this group a TIR of 32.5% on PLGS and 55.7%, 54.5% and 54.1% in AID months 1 to 3. That is a gain of 23.2, 22.0 and 21.6 points, or 22.3 points when the three AID months are averaged, which is the convention the abstract's other figures follow. The Results ("by >20 percentage points") and the Conclusions ("22–23 percentage point change") agree with the table, so the abstract is the only place with 13.2. The abstract figure understates the largest stratified effect by about 9 points (41%), and it makes that effect look smaller than the under-18 effect (14.0) when the table shows it is about 1.6 times as large.
What the paper reports
Abstract, Results:
Compared with PLGS, AID increased TIR on average from 58.4 to 70.5%.
Glycemic improvements were most pronounced in those <18 years old (TIR improvement 14.0 percentage points) and those with baseline GMI >8.0 (TIR improvement 13.2 percentage points).
Results, second paragraph:
Glycemic outcomes improved most in those with baseline GMI >8.0. These improvements were highly selective: individuals in an optimal state of glycemic control (baseline GMI ≤6.9) had TIR improved by ∼4.0 percentage points and had rate of hypoglycemia on AID compared with PLGS reduced by 0.9 percentage points, while those with baseline GMI >8.0 had TIR improved by >20 percentage points, but time below range also increased slightly (Table 1).
Conclusions (the paper's discussion section), fourth paragraph:
The group with the highest GMI, >8.0, showed the greatest percent improvement in TIR with a 22–23 percentage point change, and they achieved this change with no clinically significant increase in time spent in a state of hypoglycemia. Percent time >250 mg/dL was reduced by nearly one-half along with a reduction in time >180 mg/dL of 22–23 percentage points.
Table 1, "By baseline GMI", % TIR (columns PLGS | AID month 1 | AID month 2 | AID month 3; data are means ± SD):
≤6.9 (N = 4,450) | 80.6 ± 7.3 | 84.2 ± 6.8 | 83.8 ± 7.3 | 83.6 ± 7.6
6.9–7.4 (N = 5,359) | 65.9 ± 5.4 | 75.4 ± 7.0 | 74.8 ± 7.7 | 74.4 ± 8.1
7.4–8.0 (N = 5,018) | 51.8 ± 5.0 | 67.5 ± 7.8 | 66.6 ± 8.5 | 66.2 ± 8.9
>8.0 (N = 4,064) | 32.5 ± 9.5 | 55.7 ± 11.0 | 54.5 ± 11.5 | 54.1 ± 12.0
What the paper's own numbers show
Method. First I worked out the convention the abstract uses for "improvement", using the overall rows of Table 1. The abstract's overall figures (TIR 58.4 to 70.5%, GMI 7.5 to 7.1, time <70 mg/dL 1.66 to 1.46%) equal the PLGS value and the mean of the three AID months. Then I applied the same convention to every TIR row stratified by baseline GMI and by age. For the under-18 group, which the abstract reports as one figure, I pooled the 0–12 and 13–18 rows weighted by their N. I also computed each month separately, and the same quantities for time >180 mg/dL. Every number below is printed by recompute.py.txt.
| Quantity | Location | Reported | Recomputed from the paper's own numbers |
|---|---|---|---|
| Overall TIR, PLGS → AID | Abstract; Table 1 | 58.4 → 70.5%; "average difference" 12.06 | mean of AID months 70.50%; change 12.10 (consistent) |
| Overall GMI and time <70 mg/dL, PLGS → AID | Abstract; Table 1 | 7.5 → 7.1; 1.66 → 1.46% | 7.47 → 7.08; 1.66 → 1.46% (consistent) |
| TIR change, age <18 | Abstract | 14.0 | 13.93 (N-weighted; 0–12: 14.13, 13–18: 13.80) (consistent) |
| TIR change, age <18 | Results | "≥13" | 13.0 to 15.2 in every month for both groups (consistent) |
| TIR change, baseline GMI >8.0 | Abstract | 13.2 | 22.27 (54.77 − 32.5); months 1–3: 23.2 / 22.0 / 21.6 |
| TIR change, baseline GMI >8.0 | Results | ">20" | 21.6 to 23.2 (consistent) |
| TIR change, baseline GMI >8.0 | Conclusions, para. 4 | "22–23" | 22.27 (consistent) |
| Time >180 mg/dL reduction, GMI >8.0 | Conclusions, para. 4 | "22–23" | 22.53; months 1–3: 23.4 / 22.3 / 21.9 (consistent) |
| TIR change, other GMI strata | Table 1 (text gives only "∼4.0" in Results and "3–4" in Conclusions for ≤6.9) | — | ≤6.9: 3.27; 6.9–7.4: 8.97; 7.4–8.0: 14.97 |
| Ratio of GMI >8.0 gain to <18 gain | Abstract vs Table 1 | 13.2 / 14.0 = 0.94 | 22.27 / 13.93 = 1.60 |
| Any baseline-GMI TIR change (month 1, 2, 3 or mean) within 0.15 of 13.2 | Table 1 | — | none |
The abstract's figure for the GMI >8.0 group cannot be obtained from Table 1 by any time point or summary used elsewhere in the paper. The abstract's other numbers can. Under the abstract's own convention, the value is 22.3. That agrees with the Results and with the Conclusions, which both describe the same group and the same outcome.
A small side observation, not part of the main finding: the abstract gives overall time >180 mg/dL on AID as 28.1%, while the mean of the three AID months is 28.0% (Table 1's average difference of −11.86 gives 28.04%). The difference is 0.1 points and has no bearing on any conclusion.
Figure
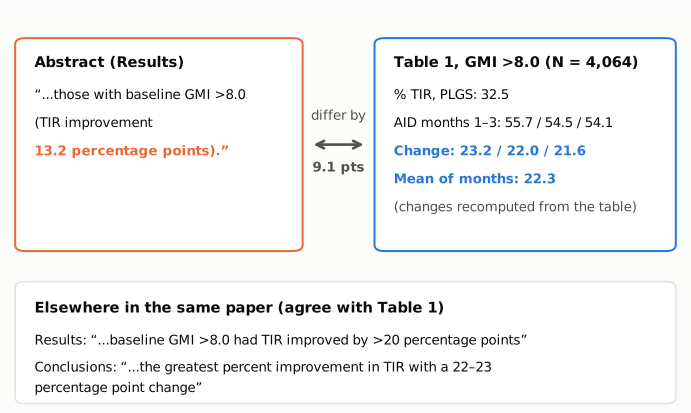
Figure 1. The conflicting passages side by side. Left (orange): the abstract's figure for the GMI >8.0 group. Right (blue): the Table 1 values for the same group, with the month-by-month changes and their mean recomputed from the table. Their mean (22.3) is 9.1 points larger than the abstract figure. Bottom: the Results and Conclusions describe the same group and outcome, and both agree with the table, not with the abstract. All quoted text is verbatim from the article as archived in PMC.
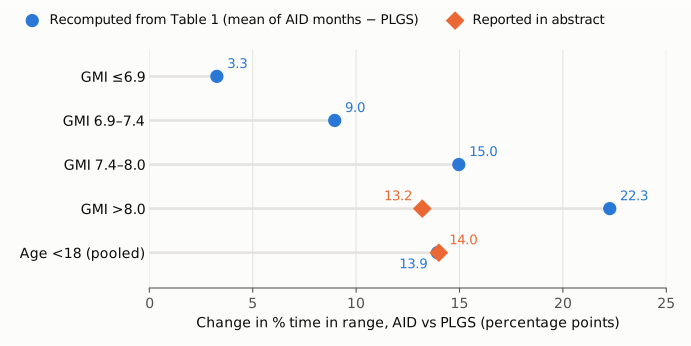
Figure 2. Change in % TIR from PLGS to AID (mean of AID months 1–3 minus PLGS), recomputed from Table 1 for the four baseline-GMI strata and for the pooled under-18 group (blue circles). The two values the abstract reports are shown as orange diamonds. For under-18s, the abstract's 14.0 agrees with the recomputed 13.9. For GMI >8.0, the abstract's 13.2 is 9.1 points below the recomputed 22.3. It is also below the recomputed value for the next stratum down (GMI 7.4–8.0, 15.0). The axis starts at zero.
Why it matters
- The wrong number is in the abstract, and only there. The abstract singles out two subgroups as having the most pronounced glycemic improvements, and the GMI >8.0 group is one of them. Readers who use only the abstract, including indexing services and secondary summaries, get an improvement of 13.2 points for this group instead of about 22.
- It reverses the comparison the abstract draws. At face value, the abstract says that people with poor baseline control (13.2) gained slightly less than people under 18 (14.0). Table 1 shows they gained about 1.6 times as much (22.3 vs 13.9). The abstract's 13.2 is also smaller than the recomputed gain of the GMI 7.4–8.0 stratum (15.0). That conflicts with the paper's own statement, in the Results, that outcomes "improved most in those with baseline GMI >8.0".
- It understates the spread across strata. The abstract's conclusion that changes with AID "may differ greatly across different demographic and clinical groups" still holds, but the table's range across GMI strata (about 3 to 22 points) is wider than the abstract implies.
- The main conclusions are not affected. The Table 1 data, the Results and the Conclusions section all carry the correct magnitude. The overall effect (58.4 to 70.5%), the comparison with randomized trials and the Conclusions section's emphasis on people with poorly controlled diabetes rest on the correct values. The error is confined to one figure in the abstract.
Explanations considered
- A different time point. Does not explain it. The change for GMI >8.0 is 23.2 in month 1, 22.0 in month 2 and 21.6 in month 3. No single month comes close to 13.2.
- A different summary convention. Does not explain it. Every other figure in the abstract (overall TIR, GMI, time below range, and the under-18 TIR gain of 14.0) matches the mean of the AID months minus PLGS. That convention gives 22.27 for GMI >8.0.
- A different outcome for the same group. Does not explain it. The reduction in time >180 mg/dL for GMI >8.0 is 21.9 to 23.4. Table 1 gives only TIR, time <70 mg/dL and time >180 mg/dL by baseline GMI, and the time <70 mg/dL changes are below 1 point.
- A different stratum. Does not explain it. The other GMI strata gain 3.3, 9.0 and 15.0 points. No baseline-GMI change at any time point or as a mean lies within 0.15 of 13.2. Five values elsewhere in Table 1 do (all the hits
recompute.py.txtfinds among the TIR and time >180 mg/dL rows): the TIR gain for age 0–12 in month 3 (13.3) and for females in month 1 (13.3), and the reduction in time >180 mg/dL for age 0–12 in month 3 (13.3), for age 19–25 in month 1 (13.3) and for females in month 1 (13.2). None of these is labelled as, or is a plausible stand-in for, the GMI >8.0 group. - An adjusted model estimate. Not supported by the paper. The Methods describe a general linear model with four repeated measures, but the paper reports no adjusted per-stratum estimate. The Results and Conclusions describe this group with the unadjusted table values (">20" and "22–23"). An adjustment that shrinks a raw gain of about 22 points to 13.2 would also contradict those two statements.
- A relative rather than absolute change. Does not explain it. The abstract says "percentage points". The relative change for GMI >8.0 (22.27 / 32.5) is 69%.
- A text-conversion artifact. Ruled out. The same "13.2" appears in the PMC text, in the Europe PMC full-text XML, in the PubMed abstract deposited by the publisher, and in the abstract reproduced on the journal's figshare supplement record. Table 1 reads the same in PMC and in Europe PMC.
- A correction already issued. None found (see Status).
Status
- Version of record. The publisher's landing page (reached from doi.org) and the publisher's PDF returned HTTP 403 to automated requests, so the typeset page could not be read directly. Four other copies of the published text agree on the passages quoted here: (1) the PMC article page; (2) the Europe PMC full-text XML, word for word; (3) the PubMed abstract (PMID 36126177), deposited by the publisher, which reads "TIR improvement 13.2 percentage points"; (4) the abstract reproduced on the journal's figshare supplement record (doi:10.2337/figshare.20645448, posted 2022-09-20). Every quotation was checked verbatim against the PMC-archived text with
src/show.py. - Supplements. The online supplement (
DC22-1217-supplement.pdf, 4 pages, version 1 of the figshare record) contains only Supplementary Figures 1–4: patient selection flow, meal boluses, total boluses and boluses by sex. It has no TIR tables or subgroup estimates and does not bear on the discrepancy. - Corrections and comments. As of 2026-10-24 I found no correction, erratum, retraction or expression of concern.
src/known.pyreturns no Crossref update relations, no PMC notices and no Europe PMC notices. The Crossref record has no update-to or updated-by entries. The PubMed record has no CommentsCorrections entries. A Crossref search found no correction item linked to this DOI. The PubPeer API returned no record (HTTP 404) for the DOI. Web searches for the title or DOI together with "erratum", "correction" or "PubPeer" found no notice or thread for this article. - Sources. PMC article PMC9862393; Europe PMC full-text XML; PubMed 36126177; figshare record doi:10.2337/figshare.20645448 and its supplement PDF; Crossref; PubPeer; https://doi.org/10.2337/dc22-1217.
Suggested correction
In the abstract, replace
those with baseline GMI >8.0 (TIR improvement 13.2 percentage points)
with
those with baseline GMI >8.0 (TIR improvement 22.3 percentage points)
The value 22.3 is the mean of AID months 1–3 minus PLGS from Table 1 ((55.7 + 54.5 + 54.1) / 3 − 32.5 = 22.27), the same convention the abstract uses for its other figures, and it agrees with the Results (">20") and the Conclusions ("22–23"). If the authors computed this value from the underlying patient-level data, their exact figure may differ slightly in the last decimal. The authors may also wish to reconsider the wording "most pronounced in those <18 years old ... and those with baseline GMI >8.0". The table shows the GMI >8.0 gain is about 1.6 times the under-18 gain, so the two gains are not comparable in size.