← Back to the plain-language case
Abstract labels the 39.65 million prevented CVD events as deaths; Results report 13.86 million deaths
PLoS Med (2022) · doi:10.1371/journal.pmed.1004111 · PMC9725126
Summary
This microsimulation study compares hypertension screening scenarios in low- and middle-income countries. Its abstract states that almost 40 million (39,650,363) HTN-induced deaths over 10 years could be prevented by increasing screening coverage and completion (scenario S4). The Results give that same number, 39,650,363 (14.2%), as prevented CVD events, and give S4 prevented deaths as 13,856,507 (13.7%); the Author summary agrees ("almost 40 million HTN-induced CVD events and 14 million (13.7%) related deaths"). The same abstract sentence also places 13,856,507 beside the 0.6% result for improved test accuracy (S2). By the paper's own percentages, 0.6% corresponds to roughly 0.61 million deaths. So the abstract's mortality headline is about 2.9 times the Results figure, and its absolute death count for the accuracy scenario is about 23 times what the Results imply. The version of record carries this text, and no correction notice was found (as of 2026-10-23).
What the paper reports
Abstract, "Methods and findings":
The study showed that while improving test accuracy avoids 0.6% of HTN-induced deaths over 10 years (13,856,507 [9,382,742; 17,395,833]), almost 40 million (39,650,363 [31,34,233, 49,298,921], i.e., 12.7% [9.9, 15.8]) of the HTN-induced deaths could be prevented by increasing coverage and completion of a screening event in the same time frame.
Abstract, the next sentence:
Doubling the coverage only would still prevent 3,304,212 million ([2,274,664; 4,164,180], 12.1% [8.3, 15.2]) CVD events 10 years after the rollout of the program.
Author summary, "What did the researchers do and find?":
While improving test accuracy avoids only 0.6% of HTN-induced deaths over 10 years, scaling up test coverage and completion can avoid almost 40 million HTN-induced CVD events and 14 million (13.7%) related deaths.
Results, paragraph 3 (CVD events, Fig 3, scenario S4):
In fact, it leads to a reduction of over 7 million (7,031,120; 26%) CVD events in year 10 compared to current standard of care (scenario S0). In sum, this equals 39,650,363 (14.2%) prevented CVD events over the period of 10 years.
Results, paragraph 4 (deaths, Fig 4):
Whereas survival does not improve much by increasing the test accuracy with 0.6% of HTN-induced deaths avoided over 10 years, we observe a high impact by doubling the coverage of the first screen (S3) with 6.6%. In year 10 alone, more than 2 million more lives (2,392,109) can be saved by additionally increasing completing probability in scenario S4, equalling to a total of 13,856,507 (13.7%) of the HTN-induced deaths over the 10 years.
Discussion, paragraph 1:
Whereas the improvement of the test accuracy had only a small potential impact on CVD events and related mortality over 10 years (reduction of 0.5% and 0.6%, respectively), by doubling of the coverage of a first screen, 6.6% of HTN-induced deaths could be avoided over a period of 10 years, and by increasing screen completion in addition, even 13.7% of deaths would not occur.
Discussion, paragraph 2:
Moreover, according to a review on available data on HTN in the literature [30], in 2015, an estimated 7.5 million deaths were attributable to systolic blood pressure in LMICs. This number coincides with the number of deaths in our model for the baseline (S0).
Methods, "Simulation study design", which treats events and deaths as separate endpoints:
We investigated the effect of blood pressure screening on the total number of CVD events and the resulting deaths within the population.
What the paper's own numbers show
Method. Each prevented count in the Results comes with its relative reduction against the base case S0. Dividing the count by that share gives the 10-year S0 total the paper is working from: S0 CVD events = 39,650,363 / 0.142 and S0 deaths = 13,856,507 / 0.137. These implied totals let us check each abstract number. For each one we ask which outcome and which percentage it fits. We also ask what S0 total the abstract's own label and percentage would require. The printed percentages are rounded to 0.1 points, so the implied totals are accurate to within about 1%. That is far smaller than any discrepancy below. All arithmetic is in recompute.py.txt.
| Quantity | Location | Reported | Recomputed from the paper's own numbers |
|---|---|---|---|
| S4 prevented CVD events, 10 y | Results para. 3; Author summary | 39,650,363 (14.2%); "almost 40 million" events | Implied S0 CVD events = 279,227,908 (27.9 M per year). Cross-check: year-10 figures imply 27.04 M (S4) and 27.31 M (S3) S0 events in year 10 |
| S4 prevented deaths, 10 y | Results para. 4; Author summary; Discussion | 13,856,507 (13.7%); "14 million (13.7%)" deaths | Implied S0 deaths = 101,142,387 (10.11 M per year); deaths/events in S0 = 0.362 |
| S4 prevented deaths, 10 y | Abstract | 39,650,363, "12.7% [9.9, 15.8]" of HTN-induced deaths | 2.86 times the Results figure; 25,793,856 more deaths than the Results report |
| S0 deaths implied by the abstract's S4 sentence | Abstract | (39,650,363 at 12.7%) | 312,207,583 deaths (31.2 M per year). That is 1.118 times the implied S0 CVD events, so more deaths than events; and 4.16 times the 7.5 M per year the Discussion says the baseline matches (Results reading: 1.35 times) |
| S4 relative reduction | Abstract vs Results | 12.7% vs 14.2% (events) and 13.7% (deaths) | 39,650,363 / 0.127 = 312.2 M matches neither implied denominator (279.2 M or 101.1 M); gaps of 1.5 and 1.0 points |
| S2 (improved accuracy) prevented deaths, 10 y | Abstract | 0.6% "(13,856,507 [9,382,742; 17,395,833])" | 0.6% × 101,142,387 = 606,854 deaths. 13,856,507 / 101,142,387 = 0.137, the S4 share. Read as 0.6%, 13,856,507 would need 2.31 billion S0 deaths (22.8 times the implied baseline) |
| Lower bound of the S4 interval | Abstract | "31,34,233" | 7 digits; a value near 31 million needs 8. In the publisher's JATS XML, "31" and "34" are tagged as citations of references 31 and 34 |
| S3 prevented CVD events | Abstract vs Results para. 3 | "3,304,212 million" vs 3,304,212 | Read literally, the abstract says 3.30 × 10^12; the Results value is 3,304,212 |
The abstract's mortality sentence takes the S4 CVD-event count and labels it as deaths. It then moves the S4 death count next to the S2 accuracy percentage. The Author summary, Results and Discussion all agree with one another; only the abstract departs from them.
Figure
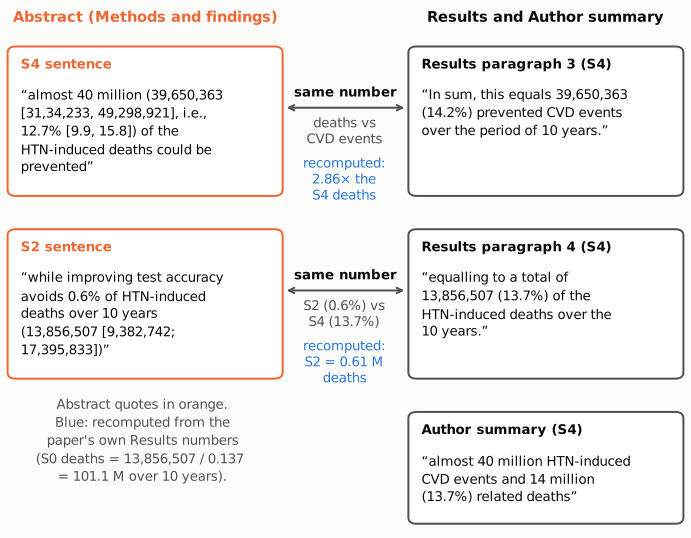
Figure 1. Left, in orange: the two clauses of the abstract's "Methods and findings" sentence, quoted verbatim. Right: the Results paragraphs (counted from the first Results paragraph as 1) and Author summary that report the same numbers. The upper connector links 39,650,363. The abstract calls it HTN-induced deaths (12.7%), while Results paragraph 3 calls it prevented CVD events (14.2%). Recomputed (blue), it is 2.86 times the S4 death count given in Results paragraph 4. The lower connector links 13,856,507. The abstract places it beside the 0.6% improved-accuracy result (S2), while Results paragraph 4 gives it as the S4 death total (13.7%). Recomputed from the paper's implied baseline of 101.1 million S0 deaths over 10 years, the S2 figure is 0.61 million. The Author summary (bottom right) gives about 40 million CVD events and 14 million deaths for S4, which agrees with the Results.
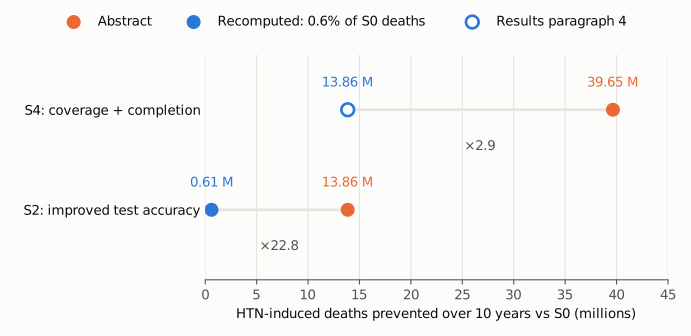
Figure 2. Deaths prevented over 10 years relative to S0, in millions, on a linear axis starting at zero. Orange: the counts the abstract attaches to each scenario's death result. For S4 (top), the open blue marker is the count in Results paragraph 4 (13.86 M); the abstract's 39.65 M is 2.9 times larger. For S2 (bottom), the filled blue marker is 0.6% of the S0 deaths implied by the Results (0.61 M); the abstract's 13.86 M is 22.8 times larger. The interval the abstract prints with 13,856,507 (9.38–17.40 M) excludes the S2 value implied by the Results.
Why it matters
The abstract's "Methods and findings" sentence is the paper's headline mortality estimate, and it is the figure most likely to be quoted. It says almost 40 million deaths could be prevented under S4. The paper's own Results put this at about 13.9 million, so the abstract overstates deaths averted by about 25.8 million. The same sentence gives the improved-accuracy scenario about 13.9 million averted deaths in absolute terms, when its 0.6% corresponds to about 0.6 million. A reader of the abstract alone would therefore overestimate the absolute mortality benefit of both interventions. The ratio between them would also be off: the abstract's numbers give about 2.9 to 1 (39.65 M vs 13.86 M), while the Results imply about 23 to 1 (13.86 M vs 0.61 M).
The direction and ranking of the scenarios do not change. Coverage plus completion still clearly outperforms improved accuracy, and the Author summary, Results and Discussion state the percentages consistently. The paper's qualitative conclusion, that screening completion and coverage matter more than test accuracy, is therefore unaffected. The error concerns the absolute numbers in the abstract and, for S4, its percentage. The abstract's 12.7% [9.9, 15.8] cannot be matched to any figure in the main text, so it is not clear what that interval refers to.
Explanations considered
- "Deaths" in the abstract might mean the same as "CVD events" in the Results. This does not fit. The Methods treat CVD events and "the resulting deaths" as separate endpoints. The Results report them in separate paragraphs with separate figures (Fig 3 events, Fig 4 deaths). The Author summary gives both numbers side by side ("almost 40 million HTN-induced CVD events and 14 million (13.7%) related deaths"). If 39,650,363 were deaths at 12.7%, the implied baseline would be 312.2 million deaths over 10 years. That exceeds the 279.2 million baseline CVD events implied by the Results. Deaths that follow CVD events cannot outnumber the events.
- A different population, subgroup or time window. The abstract sentence says "over 10 years" and "in the same time frame", matching the 10-year totals in the Results. No income-group or other subset is named. The abstract's own S3 clause ("10 years after the rollout") matches the Results' year-10 count, 3,304,212 (12.1%). The implied year-10 S0 events (27.3 M) agree with the S4 year-10 figure (27.0 M), so the abstract draws on the same model output as the Results.
- The 13,856,507 might really be the S2 death count. This does not fit. The Results give 13,856,507 explicitly as the S4 total (13.7%). At the S0 baseline implied by the Results, the S2 share of 0.6% is about 0.61 million. For 13,856,507 to be 0.6%, the S0 baseline would have to be about 2.31 billion deaths, against a simulated population of 3.15 billion adults.
- A different run or a revised analysis. No sensitivity analysis or alternative run in the article or S1 Text reports 39,650,363 as deaths or 12.7% as the S4 reduction. S1 Text gives no 10-year absolute totals, so it can neither confirm nor reconcile the 12.7%.
- A text-conversion artefact in PMC. This is ruled out for the labelling. The publisher's HTML and the JATS XML (via Europe PMC) carry the same wording. The malformed lower bound "31,34,233" does come from typesetting: in the XML, "31" and "34" are marked up as reference citations. That markup is unrelated to the deaths-versus-events labelling and the misplaced 13,856,507.
- The Discussion's 7.5 million deaths per year. This is a loose calibration check, not a precise target. The Results reading implies about 10.1 million S0 deaths per year, the same order as 7.5 million. The abstract reading implies about 31.2 million per year, about four times larger. This check is supportive only; the conclusion rests on the explicit Results labels.
Status
- Version of record. I checked the publisher's article page at journals.plos.org (via the DOI), the PMC record and the publisher's JATS XML from the Europe PMC full-text service. All carry the quoted text unchanged, including the abstract sentence, the Author summary and Results paragraphs 3–4.
- Supplements. The three supporting files are the S1 STRESS Checklist, S1 Text and S1 HPACC Consortium. S1 Text covers model methods, population scaling (3.15 billion), Table A, Fig A (yearly percentage heatmaps for events and deaths, as images) and Fig B (income-class stratification). It gives no 10-year absolute totals or denominators and does not resolve the discrepancy. No source data or code is linked.
- Corrections.
src/known.pyreturned no Crossref updates, no PMC notices and no Europe PMC notices. The Crossref record has noupdate-to,updated-byor relation entries. I found no correction, erratum, retraction or expression of concern. - PubPeer. The PubPeer search page and API returned HTTP 403 from this machine, so PubPeer could not be checked directly. A web search for the article title with "pubpeer" found no PubPeer thread.
- Sources. https://doi.org/10.1371/journal.pmed.1004111; https://pmc.ncbi.nlm.nih.gov/articles/PMC9725126/; https://www.ebi.ac.uk/europepmc/webservices/rest/PMC9725126/fullTextXML; https://api.crossref.org/works/10.1371/journal.pmed.1004111; S1 Text (journal.pmed.1004111.s002.docx).
- As of 2026-10-23.
Suggested correction
In the abstract's "Methods and findings", align the mortality sentence with the Results. For example: "while improving test accuracy avoids 0.6% of HTN-induced deaths over 10 years, 13,856,507 [9,382,742; 17,395,833] (13.7%) of the HTN-induced deaths and almost 40 million CVD events (39,650,363 [lower bound; 49,298,921], i.e., 14.2%) could be prevented by increasing coverage and completion of a screening event in the same time frame." Here "lower bound" stands for the correct lower credible bound, which is not printed anywhere in the article. The authors should also confirm:
- The absolute number of deaths avoided under S2 (about 0.6 million by the paper's own percentages), with its credible interval.
- Which percentage and interval belong to the S4 CVD-event reduction (the Results give 14.2%; the abstract's 12.7% [9.9, 15.8] matches no reported figure).
- The S4 lower credible bound, garbled as "31,34,233".
- "3,304,212 million" corrected to "3,304,212" CVD events (S3, year 10).