← Back to the plain-language case
The abstract's two interval cancer rates each pair an estimate with a mismatched interval
JAMA Netw Open (2022) · doi:10.1001/jamanetworkopen.2022.44212 · PMC9716401
Summary
The Abstract and Results give the pooled interval cancer rate, the paper's secondary outcome, as 3.73 per 1000 examinations in both groups: with a 95% CI of 0.84-3.98 after mastectomy without reconstruction, and 0.41-2.73 after mastectomy with reconstruction. The second estimate lies outside its own interval, and that interval is the one printed for the clinically occult rate in the same group (1.06; 0.41-2.73). In the first group, the printed interval, the printed odds ratio and the paper's own Figure 3 all put the estimate near 1.8, not 3.73. Figure 3 plots the with-reconstruction estimate at 3.73 with an interval of about 1.8-7.8. So the text appears to have swapped two numbers, and the paper's own figure shows the values that belong there. The paper's main conclusion, which rests on clinically occult rates, is not affected. But the secondary outcome is misreported in the Abstract, and no correction has been issued.
What the paper reports
Abstract, Results:
For mastectomy without reconstruction, the rate of clinically occult (nonpalpable) cancer per 1000 examinations (2.96; 95% CI, 1.38-6.32) and the interval cancer rate per 1000 examinations (3.73; 95% CI, 0.84-3.98) were lower than the overall cancer detection rate (including both palpable and nonpalpable lesions) per 1000 examinations (6.41; 95% CI, 3.09-13.25) across all imaging modalities.
The interval cancer rate per 1000 examinations for mastectomy with reconstruction (3.73; 95% CI, 0.41-2.73) was comparable to the pooled cancer detection rate per 1000 examinations (4.73; 95% CI, 2.32-9.63) across all imaging modalities.
Results, "Cancer Detection Rates After Mastectomy With or Without Reconstruction", first paragraph:
For mastectomy without reconstruction, the pooled overall cancer detection rate per 1000 examinations was 6.41 (95% CI, 3.09-13.25), whereas the pooled rate of interval cancer per 1000 examinations was 3.73 (95% CI, 0.84-3.98), and the rate of clinically occult (nonpalpable) cancer was 2.96 (95% CI, 1.38-6.32) per 1000 examinations.
Same section, second paragraph:
The pooled interval cancer rate per 1000 examinations (3.73; 95% CI, 0.41-2.73) was comparable to the pooled cancer detection rate observed among patients who underwent mastectomy with reconstruction. The rate of clinically occult (nonpalpable) cancer per 1000 examinations was 1.06 (95% CI, 0.41-2.73).
Results, "Comparisons Among Surveillance Methods and Outcomes":
For mastectomy without reconstruction, the OR for occult cancer was 0.46 (95% CI, 0.30-0.70; P < .001) times the overall cancer detection rate, and the OR for interval cancer was 0.28 (95% CI, 0.18-0.46; P < .001) times the overall cancer detection rate.
However, the corresponding ORs were not statistically significant for mastectomy with reconstruction; the OR for occult cancer was 0.36 (95% CI, 0.08-1.67; P = .08) times the overall cancer detection rate, and the OR for interval cancer was 2.04 (95% CI, 0.53-7.87; P = .17) times the overall cancer detection rate.
Methods, "Outcomes and Definitions" and "Data Synthesis":
The secondary outcome was the pooled interval cancer rate, defined as ipsilateral cancer detected after a normal imaging procedure but before any subsequent imaging.
We used the generalized linear mixed model framework to meta-analyze the proportion of cases across studies.
Pooled estimates and 95% CIs from the model were presented as the number of cases per 1000 examinations.
Discussion:
Considering interval cancer rates, in the clinical scenario of mastectomy with reconstruction, the interval cancer rate was similar to the overall cancer detection rate, whereas this was not the case among patients who underwent mastectomy without reconstruction, where interval cancer rates were lower than overall cancer detection rates. This difference in trends can be explained by the higher cancer detection rates among patients who underwent mastectomy without reconstruction in general rather than by a true difference in the interval cancer rates between the 2 clinical scenarios.
Figure 3 is titled "Pooled Cancer Detection Rates, Averaged Over Imaging Modality, Among Patients After Mastectomy Without or With Reconstruction". It plots the interval, clinically occult and overall rates for each group as markers with 95% CI whiskers on a linear axis from 0 to 20.
What the paper's own numbers show
Method. I used three checks, all based only on numbers the paper prints or plots.
- Interval centre. The rates are pooled with a binomial generalized linear mixed model (GLMM). Its 95% CIs are symmetric on the logit scale. At rates of a few per 1000, that makes them almost exactly symmetric on the log scale, so the estimate should sit at the CI's geometric midpoint, √(lo × hi). For the seven printed rates other than the two interval rates, this rule recovers the printed estimate to within 0.03 per 1000. On the log scale every one of them sits within 0.004 half-widths of its CI centre.
- Odds-ratio cross-check. Multiplying the odds of the overall rate by a printed odds ratio gives the rate that odds ratio implies. Without reconstruction, this reproduces the printed occult rate exactly (0.46 with 6.41 gives 2.96).
- Figure 3. I measured the plotted marker centres and whisker ends from the pixels of Figure 3 as archived in PMC. The axis was calibrated by a linear fit to the ticks at 0, 5, 10, 15 and 20; one pixel is 0.095 per 1000. For the four occult and overall rates (two per group), the measured values agree with the printed text to within about one pixel (at most 0.07).
Every number below is printed by recompute.py.txt.
| Quantity | Location | Reported | Recomputed from the paper's own numbers |
|---|---|---|---|
| Interval rate, with reconstruction: is the estimate inside its CI? | Abstract; Results p2 | 3.73 (0.41-2.73) | No. 3.73 is 1.00 above the upper limit; rounding can move each value by at most 0.005 |
| Centre of that CI, √(0.41 × 2.73) | Abstract; Results p2 | n/a | 1.06, which equals the printed occult rate for the same group, 1.06 (0.41-2.73) |
| Interval rate, with reconstruction, Figure 3 | Figure 3 | plotted | 3.73 (1.78-7.78); the centre of that whisker is 3.72 |
| Interval rate, without reconstruction: centre of CI √(0.84 × 3.98) | Abstract; Results p1 | 3.73 (0.84-3.98) | 1.83. 3.73 sits 0.92 half-widths (log scale) above the centre, next to the upper limit |
| Same rate implied by OR 0.28 × overall rate 6.41 | Results, "Comparisons" | OR 0.28 (0.18-0.46) | 1.80 |
| Same rate, Figure 3 | Figure 3 | plotted | 1.83 (0.83-3.97) |
| Occult rate, without reconstruction | Abstract; Results p1 | 2.96 (1.38-6.32) | CI centre 2.95; OR 0.46 × 6.41 gives 2.96; Figure 3 shows 2.93 (1.40-6.35) |
| Overall rate, without reconstruction | Abstract; Results p1 | 6.41 (3.09-13.25) | CI centre 6.40; Figure 3 shows 6.36 (3.02-13.21) |
| Occult rate, with reconstruction | Results p2; Additional Analyses | 1.06 (0.41-2.73) | CI centre 1.06; Figure 3 shows 1.07 (0.35-2.73) |
| Overall rate, with reconstruction | Abstract; Results p2 | 4.73 (2.32-9.63) | CI centre 4.73; Figure 3 shows 4.74 (2.35-9.69) |
| Overall rate by modality (mammography, ultrasonography, MRI) | Abstract; Results | 1.86 (1.05-3.30); 2.66 (1.48-4.76); 5.17 (1.49-17.75) | CI centres 1.86, 2.65, 5.14 (logit-scale centres 1.86, 2.66, 5.17) |
The two interval rates are the only printed rates that fail the centre check. Each fails in a different way. With reconstruction, the estimate 3.73 is confirmed by Figure 3, but the printed interval is the occult-rate interval. Without reconstruction, the printed interval is confirmed by Figure 3 (to within one pixel), but the estimate should be about 1.8. Three independent routes give that value: 1.83, 1.80 and 1.83. The value 3.73 printed for this group is the with-reconstruction estimate.
Figure
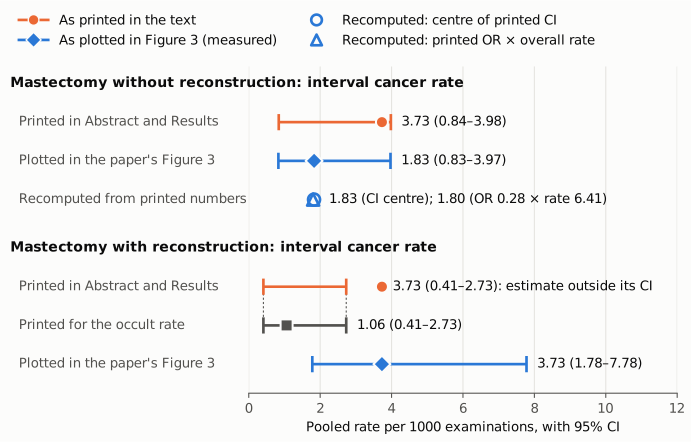
Figure 1. Pooled interval cancer rates per 1000 examinations, with 95% CIs, on one linear axis. Orange circles and bars are the rates as printed in the Abstract and Results. Blue diamonds and bars are the rates as plotted in the paper's own Figure 3, measured from its pixels (resolution about 0.1). Without reconstruction (top), the printed 3.73 sits at the top of its interval. Figure 3 and two recomputations from printed numbers put it at about 1.8: the centre of the printed CI, 1.83 (open blue circle), and the printed odds ratio 0.28 applied to the printed overall rate 6.41, which gives 1.80 (open blue triangle). With reconstruction (bottom), the printed estimate of 3.73 lies outside its printed interval. That interval matches, digit for digit, the interval printed for the clinically occult rate in the same group (grey square, 1.06; dotted guides). Figure 3 plots the interval rate at 3.73 with an interval of about 1.78-7.78. The axis starts at zero and no difference is exaggerated.
Why it matters
- The secondary outcome is misreported in the Abstract. The paper names the pooled interval cancer rate as its secondary outcome, and both group values appear in the Abstract. One of them is impossible as printed (an estimate outside its CI). The other is about twice the value that the paper's own interval, odds ratio and figure support. A reader citing the Abstract, or entering these rates in a later meta-analysis, would take a wrong number in either group: an interval of 0.41-2.73 that belongs to another outcome, or an estimate of 3.73 instead of about 1.8.
- It makes the two groups look identical. As printed, both groups have an interval cancer rate of 3.73. That fits the Discussion's reading that the different trends reflect higher detection rates without reconstruction "rather than by a true difference in the interval cancer rates between the 2 clinical scenarios". By the paper's own figure, the interval rate is about twice as high with reconstruction: 3.73 against about 1.8. The intervals overlap (about 1.8-7.8 and 0.84-3.98), so this is not evidence of a real difference. But the printed numbers show two identical estimates where the model's estimates are not identical.
- The qualitative statements survive. With the figure's values, the without-reconstruction interval rate (about 1.8) is still lower than the overall rate (6.41), and the odds ratio test (0.28, P < .001) is unchanged. With reconstruction, 3.73 against 4.73 still reads as "comparable". The headline conclusion compares clinically occult with overall detection rates, and all of those numbers check out. The error is in the reported size and precision of the secondary outcome, not in the main finding.
Explanations considered
- Rounding. Ruled out. The estimate exceeds the upper limit by 1.00 per 1000. Two-decimal rounding can account for at most 0.01.
- A different kind of interval (for example a prediction interval, or a CI on another scale). Not supported. Every other printed rate sits at the geometric centre of its CI, as a logit-scale GLMM interval should. Figure 3 plots an ordinary interval around 3.73 that contains it. And the interval 0.41-2.73 matches the occult-rate interval digit for digit.
- The text is right and Figure 3 is wrong. Not supported. For the four occult and overall rates, Figure 3 matches the text to within about one pixel. For the without-reconstruction interval rate, the figure agrees with two calculations that do not use the figure: the centre of the printed CI (1.83) and the printed odds ratio (1.80). The text estimate of 3.73 agrees with neither.
- The two groups truly have the same interval rate, 3.73. Not supported. The without-reconstruction interval 0.84-3.98 has its centre at 1.83, and the odds ratio 0.28 relative to 6.41 implies 1.80. Neither is compatible with 3.73 as the model estimate.
- A text-conversion artifact in PMC. Ruled out. The publisher's HTML page (jamanetwork.com, fullarticle/2799117) shows the same numbers in the Abstract and Results, as does the Europe PMC full-text XML.
- A correction already issued. None found (see Status).
- Side observations, not part of the main finding. (1) With reconstruction, the printed odds ratios do not reproduce the printed rates, although they do without reconstruction. The ratio 3.73/4.73 is 0.79, but the OR of 2.04 implies an interval rate of 9.60. The ratio 1.06/4.73 is 0.22, but the OR of 0.36 implies an occult rate of 1.71. Figure 3 matches the printed rates (3.73, 1.07, 4.74), not those implied by the ORs, so the figure supports correcting the interval and not the estimate. The odds ratios themselves cannot be checked from the published material. (2) The Methods say the significance tests are 2-tailed. Yet the four nonsignificant P values (.08, .17, .06, .15) are each roughly half the two-sided Wald P implied by their own odds ratio and 95% CI (0.19, 0.30, 0.15, 0.28). The 95% CIs and P values may come from different procedures. These points need the model output to resolve, and they are outside the claim of this write-up.
Status
- Version of record. Checked. The publisher's HTML (reached through doi.org; jamanetwork.com/journals/jamanetworkopen/fullarticle/2799117) gives "3.73; 95% CI, 0.84-3.98" and "3.73; 95% CI, 0.41-2.73" in the Abstract, and the same values in the Results. It carries no correction notice. The PMC text and the Europe PMC full-text XML agree. Every quotation above was checked verbatim against the PMC-archived text with
src/show.py. - Supplements. The one supplement (jamanetwopen-e2244212-s001.pdf, 6 pages: eMethods, eReferences, eTable 1 QUADAS-2, eTable 2 per-study counts) gives no pooled estimates. eTable 2 does not mark each study's reconstruction status, so the GLMM could not be refitted from the supplement. The Figure 3 image (jamanetwopen-e2244212-g003.jpg, from the PMC/Europe PMC figure files) is the source of the plotted values.
recompute.py.txtre-measures them when given that image. - Corrections and comments. As of 2026-10-24, no correction, erratum, retraction or expression of concern was found.
src/known.pyreturns no Crossref update relations, no PMC notices and no Europe PMC notices. The Crossref record has empty update-to and updated-by fields and no relations (27 citations). The PubPeer API returned no record (HTTP 404) for the DOI, and a web search for the title together with "PubPeer" found no thread. - Sources. PMC article PMC9716401; Europe PMC full-text XML and supplementary files; publisher HTML at https://doi.org/10.1001/jamanetworkopen.2022.44212; Crossref; PubPeer.
Suggested correction
In the Abstract Results and in the first Results paragraph on reconstruction status, the interval cancer rate for mastectomy without reconstruction should read approximately
1.8 (95% CI, 0.84-3.98)
instead of 3.73 (95% CI, 0.84-3.98). The exact value should come from the model output; Figure 3, the CI centre and the odds ratio give 1.83, 1.83 and 1.80.
In the Abstract Results and in the second Results paragraph, the interval cancer rate for mastectomy with reconstruction should read
3.73 (95% CI, approximately 1.8-7.8)
instead of 3.73 (95% CI, 0.41-2.73), with the exact limits taken from the model output. The interval 0.41-2.73 should stay only with the clinically occult rate, 1.06.
The authors may also wish to check the with-reconstruction odds ratios (0.36 and 2.04) against the pooled rates they compare, and to confirm that the reported P values are two-sided, as the Methods state.