← Back to the plain-language case
Registry share of Asian or Pacific Islander patients is 2.98%, not 5.9%, reversing reported underrepresentation
JAMA Network Open (2022) · doi:10.1001/jamanetworkopen.2022.39884 · PMC9634497
Summary
The study compares the racial and ethnic makeup of 8309 participants in US phase 1 metastatic-cancer drug trials with incident cases in the Cancer in North America (CiNA) registry. For the whole 2000-2018 period, the Results report that Asian or Pacific Islander (API) participants were underrepresented: 4.5% of trial participants against 5.9% of registry cases, a difference of −1.5 percentage points (P < .001). The registry count and denominator printed in the same sentence, 145 568 of 4 891 486, give 2.98%, not 5.9%. That count is the exact sum of the paper's two period counts, whose shares (2.7% and 3.4%) are printed correctly. Measured against 2.98%, trial participation is higher than the registry share under either trial count the paper gives: +1.49 points (P ≈ 2 × 10⁻¹⁵) with the Table's 371 of 8309, or +0.30 points (P = .12, not significant) with the sentence's 272 of 8308. The reported overall API underrepresentation, which the Conclusions repeat, therefore does not follow from the paper's own data. Separately, the API trial counts in the Table do not add up (121 + 151 = 272, but the "All" row is 371), and this bears on the API time trend.
What the paper reports
Results, third paragraph, the overall (2000-2018) comparison. The PMC-archived text has a hyphen before 1.5; the publisher's HTML and the Europe PMC XML have a true minus sign (U+2212):
an underrepresentation of Asian or Pacific Islander participants (trials, 272 of 8308 [4.5%]; CiNA, 145 568 of 4 891 486 [5.9%]; difference, -1.5 percentage points; P < .001)
The same paragraph, period-specific comparison (repeated in the Abstract):
Asian or Pacific Islander patients (2000-2011: trials, 121 of 3245 [3.7%]; CiNA, 75 033 of 2 800 711 [2.7%]; difference, 1.1 percentage points; 2012-2018: trials, 151 of 5063 [3.0%]; CiNA 70 535 of 2 090 775 [3.4%]; difference, -0.75 percentage points)
Results, second paragraph, the overall trial count. The Abstract gives "371 Asian or Pacific Islander participants (4.5%)":
Of the 8309 total participants, 23 (0.3%) were American Indian or Alaska Native, 371 (4.5%) were Asian or Pacific Islander
The Table, "Phase 1 trials", Asian or Pacific Islander column:
All (N = 8309) | 371 (4.5) 2000-2011 (n = 3245) | 121 (3.7) 2012-2018 (n = 5063) | 151 (3.0)
The Table, "Industry trials", same column:
2012-2018 (n = 4628) | 226 (4.9)
Methods, "Statistical Analysis", the test, the pooling and the sign convention:
Proportions accounting for the sample size of each trial were calculated for each racial and ethnic group by combining the total number of participants for each racial and ethnic group and dividing by the total number of trial participants
differences with 95% CIs were estimated using a 2-sample test for equality of proportions with continuity correction
with positive percentage differences indicating overrepresentation and negative percentage differences indicating underrepresentation
Results, third paragraph, the ratios shown in Figure 3:
especially Asian and Pacific Islander patients (ratio of trial to CiNA participants, 1.44 in 2000-2011 to 0.87 in 2012-2018)
Key Points, "Findings":
found worsening underrepresentation of American Indian or Alaska Native, Asian or Pacific Islander, Black, and Hispanic or Latinx participants over time
Conclusions:
These include underenrollment of Asian or Pacific Islander patients, Black patients, and Hispanic or Latinx patients in clinical trials overall and underenrollment of American Indian or Alaska Native patients, Asian or Pacific Islander patients, Black patients, and Hispanic or Latinx patients in trials conducted at academic institutions
What the paper's own numbers show
Method. I took every count printed in the Abstract, Results, Table and Supplement eTable, recomputed each share, and checked whether overall counts equal the sums of the period counts. I then reran each comparison with the test the Methods name: a two-sample test for equality of proportions with continuity correction (R's prop.test, whose statistic is the Yates-corrected χ² on the 2 × 2 table), with its continuity-corrected 95% CI. As a check that this is the paper's test, it reproduces the reported White 2000-2011 result (+0.76 points, P = .235; reported 0.8, P = .23) and the overall White (+2.01; reported 2.0) and Black (−5.64; reported −5.6) differences. It also matches every significance marker in the paper's Figure 2: P < .001 for API 2000-2011, P = .048 for American Indian or Alaska Native 2012-2018 (marked P < .05), and no marker for API 2012-2018 (P = .13). Every number below is printed by recompute.py.txt.
Additivity. The overall CiNA counts equal the sums of the period counts, for API (75 033 + 70 535 = 145 568), for the denominator (2 800 711 + 2 090 775 = 4 891 486), and for White and Black. The overall API registry share is therefore the pooled share of the two periods, so it must lie between 2.68% and 3.37%. It cannot be 5.9%.
| Quantity | Location | Reported | Recomputed from the paper's numbers |
|---|---|---|---|
| CiNA API share, 2000-2011 | Abstract; Results ¶3 | 75 033 / 2 800 711 [2.7%] | 2.68% (consistent) |
| CiNA API share, 2012-2018 | Abstract; Results ¶3 | 70 535 / 2 090 775 [3.4%] | 3.37% (consistent) |
| CiNA API count, 2000-2018 | Results ¶3 | 145 568 | 75 033 + 70 535 = 145 568 (exact) |
| CiNA API share, 2000-2018 | Results ¶3 | 145 568 / 4 891 486 [5.9%] | 2.98%. 5.9% of 4 891 486 would be 288 598 cases (1.98 × the printed count) |
| CiNA groups summed, with API at 5.9% | derived | — | White + Black + AIAN + API = 5 000 409, which exceeds the 4 891 486 total by 108 923 |
| Trial API share, 2000-2018 (sentence) | Results ¶3 | 272 / 8308 [4.5%] | 3.27%. The bracketed 4.5% belongs to 371/8309 |
| Trial API share, 2000-2018 (Table) | Table "All"; Abstract; Results ¶2 | 371 / 8309 (4.5) | 4.47% (consistent) |
| Overall API difference, trials − CiNA, using 371/8309 | Results ¶3 | −1.5 pp, P < .001 | +1.49 pp (95% CI +1.04 to +1.94), P = 1.9 × 10⁻¹⁵ |
| Overall API difference, using 272/8308 | Results ¶3 | −1.5 pp, P < .001 | +0.30 pp (95% CI −0.09 to +0.69), P = .12 |
| Overall API difference from the printed shares | Results ¶3 | −1.5 pp | 4.5 − 5.9 = −1.4; 4.47 − 5.9 = −1.43. Neither gives −1.5 |
| Overall API trial/CiNA ratio | not reported | (underrepresentation, ratio < 1) | 1.50 (371/8309) or 1.10 (272/8308) |
| API difference, 2000-2011 | Abstract; Results ¶3 | +1.1 pp | +1.05 pp (95% CI +0.38 to +1.72), P = .0003 (rounding-level) |
| API difference, 2012-2018 | Abstract; Results ¶3 | −0.75 pp, no P value | −0.39 pp (95% CI −0.87 to +0.09), P = .13; printed shares give 3.0 − 3.4 = −0.4 |
| API trial/CiNA ratio, 2000-2011 → 2012-2018 | Results ¶3; Figure 3 | 1.44 → 0.87 | 1.39 → 0.88 |
| White overall difference (method check) | Abstract; Results ¶3 | +2.0 pp, P < .001 | +2.01 pp, P = 5.8 × 10⁻⁷ (consistent) |
| Black overall difference (method check) | Results ¶3 | −5.6 pp, P < .001 | −5.64 pp, P = 7.9 × 10⁻⁵⁷ (consistent) |
Against the registry share its own counts imply, the overall API difference has the reported size (1.49 points with the Table's count) but the opposite sign.
A second, separate inconsistency: the API trial counts. In the Table every other column adds up across the period rows (White 2780 + 4374 = 7154; Black 244 + 270 = 514; and so on). The API column does not.
| Quantity | Location | Reported | Recomputed |
|---|---|---|---|
| API, 2000-2011 + 2012-2018 vs "All" | Table, phase 1 trials | 121 + 151; All = 371 | 121 + 151 = 272, which is the count used in the Results sentence; 99 short of 371 |
| API, industry-funded subset vs all trials, 2012-2018 | Table | industry 226 (4.9); all trials 151 (3.0) | the subset exceeds the total by 75. The industry rows themselves add up (106 + 226 = 332) |
| "All" row minus the 2000-2011 row | Table | — | 371 − 121 = 250 (4.94% of 5063), which is ≥ the industry count of 226 |
| Supplement eTable (EGFR-positive trials added back) minus Table, overall vs by period | eTable; Table | — | additive for White (406 = 406), Black (17 = 17), AIAN (1 = 1) and Hispanic (4 = 4). For API, 870 − 371 = 499 overall but 598 by period. A 2012-2018 Table count of 250 would make API additive too |
| API difference, 2012-2018, if the count were 250 | derived | — | +1.56 pp (95% CI +0.96 to +2.17), P = 9.7 × 10⁻¹⁰; ratio 1.46 |
So the printed 151, the printed 371, or both cannot be right. The paper's other numbers (the industry subset and the eTable) are consistent with 371 overall and 250 in 2012-2018, but the paper alone does not establish which figure is wrong.
Smaller points, none of which changes a conclusion. The CiNA White share for 2012-2018, 1 735 077 / 2 090 775 = 82.99%, is printed as 82.9% (difference recomputes to +3.40 against the printed 3.5). The Table footnote gives 5076 participants in trials reporting ethnicity, but its period denominators sum to 1792 + 3295 = 5087. The overall Black comparison uses 8308 as the denominator against 8309 elsewhere. The text ratios for Black (0.64 → 0.42) and Hispanic or Latinx (1.55 → 0.98) recompute to 0.65 → 0.44 and 1.49 → 0.98. In the paper's Figure 3 the plotted API point estimates sit near 1.39 and 0.88, and the text values 1.44 and 0.87 lie close to the ends of the plotted intervals (read from the image, so approximate).
Figure
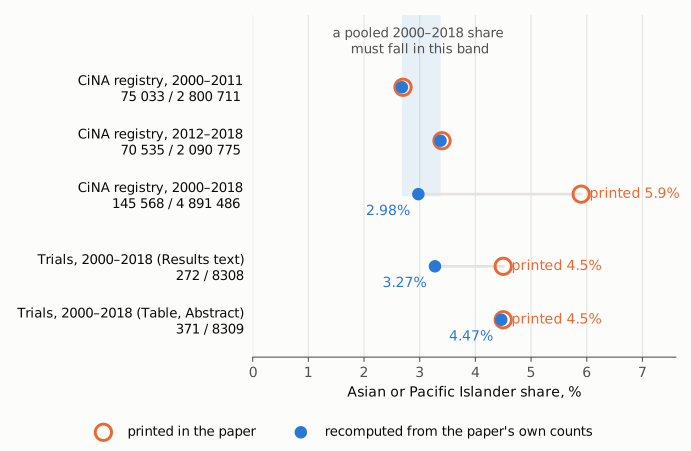
Figure 1. Asian or Pacific Islander shares on one percentage axis starting at zero. Orange rings are the values printed in the paper. Blue dots are the values recomputed from the numerator and denominator printed with them (listed under each row label). For each period the two agree (2.7 vs 2.68; 3.4 vs 3.37). For 2000-2018 the paper prints 5.9%, but its own count, 145 568 of 4 891 486, gives 2.98%. Because that count and denominator are the sums of the period counts, the pooled share has to fall in the shaded band between the two period shares. Both trial figures the paper gives for 2000-2018, 3.27% (272/8308, Results sentence, printed there as 4.5%) and 4.47% (371/8309, Table and Abstract), lie at or above 2.98%, not below it.
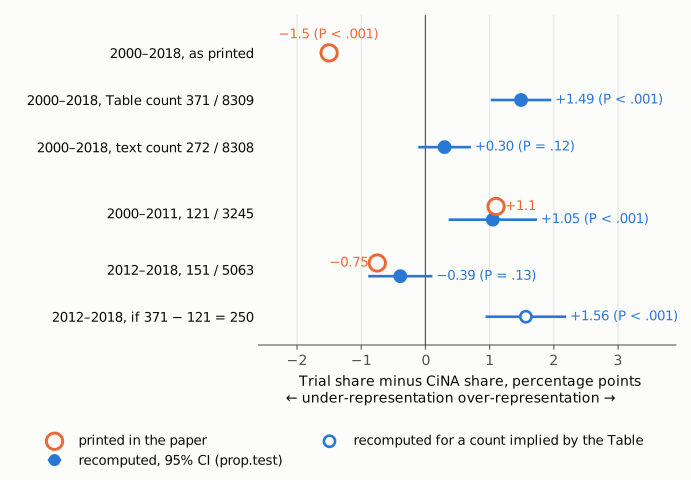
Figure 2. Trial share minus CiNA share, in percentage points, with 95% CIs from the test the paper names (two-sample test for equality of proportions with continuity correction). The thin vertical line marks no difference; by the paper's convention, negative values mean underrepresentation. Orange rings are printed values (the paper gives no CIs for these comparisons). For 2000-2018 the paper prints −1.5 (P < .001). Recomputed against the registry share its counts imply, the difference is +1.49 with the Table's count and +0.30 (P = .12) with the sentence's count. For 2000-2011 the printed and recomputed values agree. For 2012-2018 the printed −0.75 recomputes to −0.39 (P = .13). The hollow blue marker shows the 2012-2018 difference if the all-trial count were 371 − 121 = 250, the value the Table's "All" row and industry subset imply; it is a derived scenario, not a value printed in the paper.
Why it matters
- A reported finding is reversed. The Results state a significant overall underrepresentation of API participants over 2000-2018 (−1.5 points, P < .001). The paper's own counts show overrepresentation (+1.49 points, ratio 1.50, with the Table's 371) or no detectable difference (+0.30 points, P = .12, ratio 1.10, with the sentence's 272). Neither supports underrepresentation.
- The Conclusions repeat it. They list "underenrollment of Asian or Pacific Islander patients ... in clinical trials overall". The only overall API comparison in the paper is the erroneous one. If "overall" is instead read as all trials in the more recent period, the 2012-2018 difference recomputes to −0.39 points (P = .13), and the paper's own Figure 2 marks no significant difference there.
- The API part of the "worsening" claim is weaker than presented. The Key Points report worsening underrepresentation of API participants over time. With the printed period counts, the API difference moves from significant overrepresentation (+1.05 points) to a non-significant −0.39 points: a decline, but to parity rather than to underrepresentation. If the Table's "All" row is right and the 2012-2018 count is 250, API participants were overrepresented in both periods (+1.05 and +1.56 points) and there is no worsening for this group.
- Related statements in the Conclusions are also not supported by the paper's counts. These are derived comparisons the paper does not print, offered for the editor's attention rather than as the main finding. The Conclusions list API underenrollment at academic centers, but the Table's academic counts are above the CiNA share in both periods: 68/1806 (3.77%) vs 2.68%, +1.09 points, P = .005; 153/4145 (3.69%) vs 3.37%, +0.32 points, P = .28. The Conclusions also list Hispanic or Latinx underenrollment overall and at academic centers. Pooled from the paper's counts, the overall comparison is 401/5076 (7.90%) vs 325 415 / 4 891 486 (6.65%), +1.25 points (P = .0004). At academic centers it is 276/3523 (7.83%), +1.18 points (P = .005), and it is positive in both periods.
- What is not affected. The CiNA period shares and the comparisons for White and Black patients reproduce. The paper's central finding of strong and increasing underrepresentation of Black patients (−4.00 to −6.89 points) does not depend on these errors.
Explanations considered
- Text-conversion artifact (lost minus sign, decimal or digit). This does not account for the numbers. The publisher's HTML, the Europe PMC XML and the PMC archive carry the same sentence, the first two with a true minus sign. No dropped sign or decimal turns 2.98 into 5.9, and the sentence is running prose, not a table cell.
- A different registry population or denominator for the overall comparison. This does not account for the numbers. The sentence prints its own numerator and denominator (145 568 of 4 891 486), and that ratio is 2.98%. Both numbers are the exact sums of the period counts.
- A weighted rather than pooled share. This does not account for the numbers. The Methods describe pooled proportions. Any weighted average of the two period shares (2.68% and 3.37%) also lies between them.
- 5.9% is a typographical slip, and the difference and P value are right. This does not account for the numbers. Against 2.98%, the difference is positive with either trial count, so −1.5 and the stated underrepresentation cannot stand with a corrected share.
- The trial count, not the registry share, is the problem. This is only part of the picture. The sentence's trial figures are themselves inconsistent (272/8308 is 3.27%, yet it is printed as 4.5%), but neither trial count gives a negative difference against 2.98%. Only the registry share produces the reversed sign.
- The overall comparison comes from the sensitivity cohort that adds back the EGFR-positive trials. This does not account for the numbers. That cohort changes only the trial side; the registry is the same. The supplement's eTable gives trial counts only (API 870/9273 = 9.4% overall), and its eFigure lists CiNA API shares of 2.68% and 3.39% for the two periods, with no overall value and no 5.9%. Its higher trial share would make the difference even more positive.
None of these explains the printed 5.9%. The material published with the paper does not show how it arose.
Status
- Version of record. Checked. The DOI resolves to the publisher's full-text page (jamanetwork.com, article 2798149), which carries the sentence as quoted, with a true minus sign, and shows no correction notice. Its reader-comment section displays no comments. The Europe PMC full-text XML (publisher-supplied JATS) has the identical sentence. All quotes above were confirmed verbatim against the PMC-archived text.
- Supplement. Checked: jamanetwopen-e2239884-s001.pdf (eTable and eFigure, the sensitivity analysis including EGFR-positive trials), from the Europe PMC supplementary-files archive. The eTable gives trial counts only; the eFigure lists CiNA API shares of 2.68% (2000-2011) and 3.39% (2012-2018), consistent with the main text and never 5.9%. It does not resolve the discrepancy. No source data or code are deposited. The same archive holds the article's figures. Figure 2 shows CiNA API bars near 2.7% and 3.4% for the two periods and has no overall bar; Figure 3 is described above.
- Corrections and notices. None found as of 2026-10-23. Crossref lists no update-to or updated-by relations. There are no PMC or Europe PMC correction, retraction or expression-of-concern notices, and the Europe PMC record (PMID 36326764) has no comment or correction links.
- PubPeer. The PubPeer search page returned HTTP 403 and its API returned a human-verification page, so PubPeer could not be checked directly in this session. A web search could not be run in this session either. An earlier screening step in this review found no correction as of 2026-10-22.
Sources: doi.org/10.1001/jamanetworkopen.2022.39884; publisher full text; PMC9634497; Europe PMC full-text XML; Europe PMC supplementary files; Crossref record.
Suggested correction
- Results, overall API comparison. Recompute the registry share as 145 568 / 4 891 486 = 3.0% and settle the trial count (item 2). The sentence would then report an overrepresentation, "trials, 371 of 8309 [4.5%]; CiNA, 145 568 of 4 891 486 [3.0%]; difference, 1.5 percentage points; P < .001", or, if 272 of 8308 is correct, "trials, 272 of 8308 [3.3%]; CiNA, 145 568 of 4 891 486 [3.0%]; difference, 0.3 percentage points; P = .12", with no significant difference.
- Table, API column. Reconcile the "All" row (371) with the period rows (121 + 151 = 272), and the all-trial 2012-2018 count (151) with the industry-funded 2012-2018 count (226). Then update the 2012-2018 API comparison in the Abstract and Results (currently −0.75 points, which recomputes to −0.39 with 151), Figure 2, Figure 3 and the ratios in the text.
- Conclusions and Key Points. Revise the statement of API underenrollment "in clinical trials overall", and the API part of "worsening underrepresentation ... over time", in line with items 1 and 2. Check the statements on API and Hispanic or Latinx underenrollment overall and at academic centers against the Table's counts, which are above the CiNA shares.
- Minor. Change 82.9% to 83.0% for 1 735 077 / 2 090 775, reconcile the Hispanic or Latinx denominator (5076 vs 1792 + 3295 = 5087), use 8309 consistently, and state whether the ratios quoted in the text are point estimates.