← Back to the plain-language case
Main IGF-1 hospitalization odds ratio 0.62 is printed with a 95% CI that excludes it
eLife (2022) · doi:10.7554/eLife.79720 · PMC9576268
Summary
The paper's primary (random-effects IVW) estimate for genetically predicted IGF-1 and COVID-19 hospitalization is given as OR 0.62 (95% CI 0.25–0.51, p = 0.018) in the Abstract, the Results and Table 2. That interval cannot belong to that estimate, because its upper limit (0.51) is below the point estimate (0.62). On the log scale the printed interval is centred on 0.36, and it would imply p ≈ 1.5 × 10⁻⁸, not 0.018. The paper's own OR and p-value imply a 95% CI of about 0.42–0.92. The hospitalization forest plot in the paper's Figure 2 (the panel titled "A. MR analysis for IGF-1 and COVID-19 hospitalization"; "the forest plot" below) draws the IVW whisker at that interval, and the interval is close to the paper's MR-PRESSO (0.43–0.88) and BMI-adjusted IVW (0.41–0.90) intervals. The OR, the p-value and the stated conclusions are unaffected, but the precision printed for a headline result in the Abstract is wrong and overstates how far the data exclude small effects.
What the paper reports
Abstract, Methods part:
Random-effects inverse variance weighted (IVW) MR approach was used as the primary MR method and the weighted median, MR-Egger, and MR Pleiotropy RESidual Sum and Outlier (MR-PRESSO) test were conducted as sensitivity analyses.
Abstract, Results part, and repeated word for word in the first paragraph of Results:
For one standard deviation increase in genetically predicted IGF-1 levels, the odds ratio was 0.77 (95% confidence interval [CI], 0.61–0.97, p=0.027) for COVID-19 susceptibility, 0.62 (95% CI: 0.25–0.51, p=0.018) for COVID-19 hospitalization, and 0.85 (95% CI: 0.52–1.38, p=0.513) for COVID-19 severity.
Table 2 ("Sex hormones, SHBG, IGF-1, and COVID-19 outcomes in Mendelian randomization (MR) analyses"), IGF-1 IVW row. Columns, in each outcome block: SNPs | OR (95% CI) | p Effect | p Heterogeneity | p Intercept, for susceptibility, hospitalization and severity:
IGF-1 | IVW | 16 | 0.77 (0.61, 0.97) | 0.027 | 0.175 | – | 16 | 0.62 (0.25, 0.51) | 0.018 | 0.715 | – | 18 | 0.85 (0.52, 1.38) | 0.513 | 0.601 | -
Table 2, IGF-1 MR-PRESSO row (in all three MR-PRESSO cells the upper limit is printed first):
IGF-1 | MR-PRESSO | 16 | 0.77 (0.98, 0.61) | – | – | – | 16 | 0.62 (0.88, 0.43) | – | – | – | 18 | 0.85 (1.34, 0.54) | - | - | -
Results, first paragraph:
Associations of IGF-1 levels with COVID-19 susceptibility and hospitalization were not statistically significant after Bonferroni correction, albeit showing a nominal significance at p<0.05.
Results, second paragraph (Table 6, BMI-associated SNPs removed):
As shown in Table 6, after removing SNPs associated with BMI, we found similar associations of genetically predicted IGF-1 levels with the risk of COVID-19 susceptibility (OR = 0.76; 95% CI: 0.60–0.96, p=0.021), hospitalization (OR = 0.61; 95% CI: 0.41–0.90, p=0.014) …
Discussion, last paragraph (the Abstract's Conclusions open with the same sentence, without "In conclusion,"):
In conclusion, our study indicated that genetically predicted high IGF-1 levels were associated with decrease the risk of COVID-19 susceptibility and hospitalization, but these associations did not survive the Bonferroni correction of multiple testing.
What the paper's own numbers show
Method. IVW Mendelian-randomization estimates are log odds ratios with a normal (Wald) standard error, so the reported OR is exp(β), the 95% CI is exp(β ± 1.96·SE) and p = 2Φ(−|β|/SE). Two checks follow. (1) The geometric centre √(lower × upper) of a printed CI must equal the OR, apart from rounding, and the CI's width fixes SE and hence p. (2) The OR and p fix SE = |ln OR| / Φ-1(1 − p/2), and hence the CI. I applied both checks to the hospitalization cell, to the other five IGF-1 IVW cells of Table 2 (main analysis) and Table 6 (BMI-associated SNPs removed), and to the neighbouring IGF-1 estimates. To see whether rounding could matter, I let OR range over [0.615, 0.625) and p over [0.0175, 0.0185). Finally, I read the vector coordinates of the forest plot (the panel "A. MR analysis for IGF-1 and COVID-19 hospitalization" in the paper's Figure 2, page 8 of the publisher's v2 PDF) and converted the drawn whiskers to ORs using the plot's own linear axis ticks (0, 1, 2, 3). Every number below is printed by recompute.py.txt.
| Quantity | Location | Reported | Recomputed from the paper's own numbers |
|---|---|---|---|
| IGF-1 → hospitalization, IVW | Abstract; Results para. 1; Table 2 | OR 0.62 (95% CI 0.25–0.51), p = 0.018 | 0.62 lies outside 0.25–0.51 |
| Centre of the printed interval | same | expected to equal 0.62 | √(0.25 × 0.51) = 0.357 |
| p implied by the printed interval | same | 0.018 | SE(log OR) 0.182; p = 1.5 × 10⁻⁸ |
| 95% CI implied by OR 0.62 and p = 0.018 | same | 0.25–0.51 | z = 2.366, SE(log OR) = 0.202, CI 0.417–0.921 |
| Same, allowing for rounding of OR and p | same | — | lower limit 0.410–0.424, upper limit 0.918–0.924; no rounding gives an upper limit below 0.515 |
| IVW whisker drawn in the forest plot | Forest plot (label "0.62(0.25,0.51)") | — | drawn from 0.420 to 0.920, box at 0.620 |
| Calibration of that reading: MR-Egger bar | Forest plot (label "0.72(0.37,1.38)") | 0.72 (0.37, 1.38) | drawn 0.370–1.380, box at 0.720 |
| Weighted-median bar | Forest plot (label "0.75(0.44,1.28)") | 0.75 (0.44, 1.28) | drawn 0.450–1.240, box at 0.750: matches Table 6's BMI-adjusted weighted median, 0.75 (0.45, 1.24), not the label or Table 2 |
| IGF-1 → hospitalization, MR-PRESSO | Table 2 | 0.62 (0.88, 0.43) | contains 0.62; centre 0.615 |
| IGF-1 → hospitalization, IVW without BMI SNPs | Table 6; Results para. 2 | 0.61 (0.41–0.90), p = 0.014 | CI from OR and p: 0.41–0.90; p from CI: 0.013 |
| IGF-1 → susceptibility, IVW | Abstract; Table 2 | 0.77 (0.61–0.97), p = 0.027 | CI from OR and p: 0.61–0.97; p from CI: 0.027 |
| IGF-1 → severity, IVW | Abstract; Table 2 | 0.85 (0.52–1.38), p = 0.513 | CI from OR and p: 0.52–1.38; p from CI: 0.505 |
The other five IGF-1 IVW cells of Tables 2 and 6 pass both checks to rounding precision: in each, the printed p lies inside the range of p-values implied by every rounding of the printed limits. So for these tables the Wald method fits how the paper's intervals were produced. Only the main-analysis hospitalization IVW cell fails, and it fails both checks by a wide margin. Its OR and p agree with each other and point to a CI of about 0.42–0.92. Three other items in the paper are consistent with that interval: the IVW whisker drawn in the forest plot (0.42–0.92, with the same axis reading reproducing the MR-Egger bar exactly), the MR-PRESSO interval for the same 16 SNPs (0.43–0.88), and the IVW interval with one BMI-associated SNP removed (0.41–0.90). The last two come from largely the same data as the IVW estimate, so they are not independent confirmations. No other cell in the paper prints the pair (0.25, 0.51).
Figure
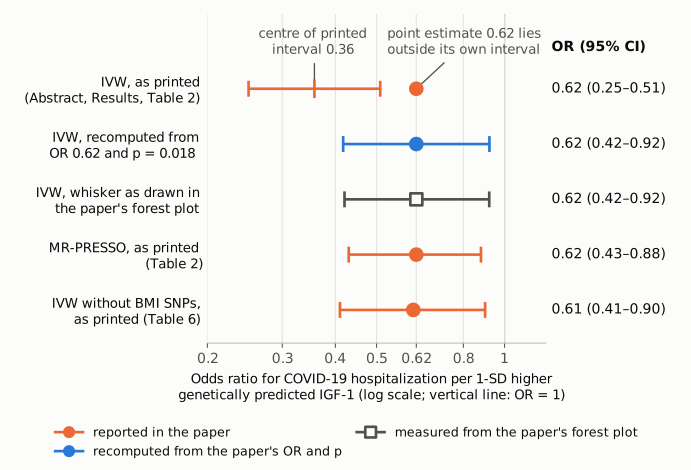
Figure 1. IGF-1 and COVID-19 hospitalization: odds ratio per 1-SD higher genetically predicted IGF-1, with 95% CI, on a log scale. The vertical line marks OR = 1. Orange: values printed in the paper. The top row is the primary IVW estimate as printed in the Abstract, the Results and Table 2, 0.62 (0.25–0.51); the short tick marks the interval's geometric centre, 0.36, which an interval for 0.62 would have at 0.62. The bottom two orange rows are the paper's MR-PRESSO interval for the same analysis (Table 2) and its IVW interval after removing BMI-associated SNPs (Table 6). Blue: the 95% CI recomputed from the printed OR 0.62 and p = 0.018, 0.42–0.92. Grey open square: the IVW whisker as actually drawn in the paper's hospitalization forest plot (Figure 2, panel "A. MR analysis for IGF-1 and COVID-19 hospitalization"), measured from the PDF's vector coordinates, 0.42–0.92. All numbers are from the paper or from recompute.py.txt.
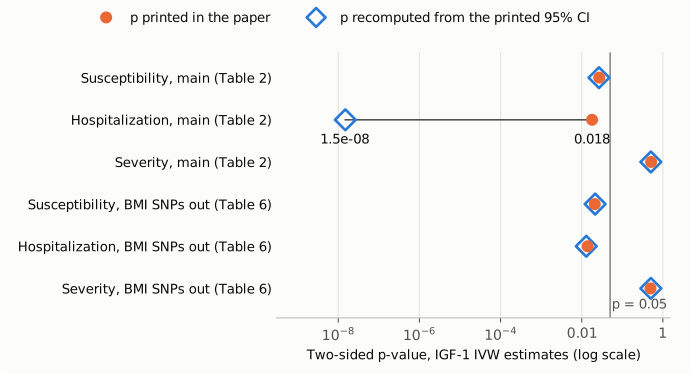
Figure 2. For each IGF-1 IVW estimate in Table 2 (main analysis) and Table 6 (BMI-associated SNPs removed), the printed two-sided p-value (orange dots) and the p-value implied by the printed 95% CI (blue open diamonds), on a log scale. The vertical line marks p = 0.05. In five cells the two agree to rounding (for example 0.027 printed and 0.027 implied for susceptibility). For main-analysis hospitalization the printed interval implies p = 1.5 × 10⁻⁸, against a printed p of 0.018. Among the IGF-1 IVW cells of Tables 2 and 6, the error is confined to that one interval.
Why it matters
- It is the primary estimate for one of the two outcomes named in the title, and it is in the Abstract. The IVW method is declared the primary analysis, and the hospitalization association is one of the two the title calls protective. Readers who see only the Abstract, and meta-analysts who extract the interval from it or from Table 2, get an impossible interval.
- Taken literally, the printed interval overstates the precision and the strength of the effect. The printed limits would say the data exclude any odds reduction smaller than 49% (upper limit 0.51) and are compatible with a reduction of up to 75%. The interval implied by the paper's own OR and p (0.42–0.92) is wider and reaches much closer to the null: it is compatible with a reduction as small as 8%. Anyone who back-calculates a standard error from the printed limits for pooling or power calculations gets SE(log OR) 0.18 around a centre of 0.36, not 0.20 around 0.62.
- The paper's conclusions do not change. The OR (0.62), the direction, the nominal significance (p = 0.018) and the statement that the association does not survive Bonferroni correction all rest on the OR and p, which agree with each other and with the corrected interval. The sensitivity analyses the paper cites in support are unaffected.
Explanations considered
- Upper and lower limits printed in reverse order. Does not explain it. The paper does print the upper limit first in its MR-PRESSO cells, for example "0.62 (0.88, 0.43)", but those intervals still contain their estimates. Here 0.25 < 0.51 is in normal order, and in either order neither limit reaches 0.62.
- A different confidence level, a one-sided interval, or a different scale. Ruled out. Any interval for an estimate, at any level and whether one- or two-sided, contains that estimate. The limits are not on the log-OR scale (ln 0.62 = −0.478). And a symmetric log-scale interval of the printed width around 0.62 would still have to straddle 0.62.
- The interval belongs to another model, outcome or row. Not supported. The OR, the interval, the p-value and the 16 SNPs sit in the same cell of Table 2, and the Abstract and the Results repeat the same triple. No other cell of Table 2 or Table 6 prints (0.25, 0.51). The paper's forest plot draws the IVW whisker at 0.42–0.92 while labelling it "0.62(0.25,0.51)", so the plotted whisker and the printed label disagree.
- Rounding. Ruled out. Over every OR and p that round to 0.62 and 0.018, the implied upper limit stays between 0.918 and 0.924. An upper limit that rounds to 0.51 is below 0.515, which is below any OR that rounds to 0.62.
- A conversion or typesetting artifact in the PMC copy. Ruled out. The same "0.25–0.51" appears in the publisher's typeset PDF (version 2: page 1, Abstract; page 5, Results; page 7, Table 2; and the forest-plot label on page 8), on the eLife article page, and in the PMC and Europe PMC full text.
- A correction already issued. None found (see Status).
- Side observation on the forest plot, not part of the main finding. In the forest plot the MR-PRESSO row is labelled "0.62(0.60,0.64)" with p 0.016 and drawn from 0.60 to 0.64, while Table 2 gives the MR-PRESSO hospitalization interval as 0.62 (0.88, 0.43). The weighted-median bar is drawn at 0.45–1.24 against a label of 0.44–1.28; the drawn bar equals Table 6's BMI-adjusted weighted-median hospitalization interval, 0.75 (0.45, 1.24), not Table 2's 0.75 (0.44, 1.28). So the plot is not a clean copy of a single analysis. Its IVW whisker (0.42–0.92) matches neither Table 6's IVW interval (0.41–0.90) nor the printed label, and it does match the back-calculation from the OR and p, so it is consistent with the 0.42–0.92 interval but does not decide it. None of this affects the main finding, but the authors may wish to reconcile the figure with Tables 2 and 6.
- Side observation on Table 3, not part of the main finding. In Table 3 (10 SNPs in the IGF-1 gene region; the same values are quoted in Results para. 1), two of the three IVW p-values do not match their intervals. Hospitalization 0.90 (0.74, 1.10) is printed with p = 0.645, but the interval implies p = 0.309 (0.286–0.333 over every rounding of the limits). Severity 1.01 (0.82, 1.24) is printed with p = 0.415, but the interval implies p = 0.937 (0.899–0.976). Susceptibility 0.99 (0.91, 1.07), p = 0.777, passes (implied 0.747, range 0.657–0.841). This sensitivity analysis uses correlated SNPs with a linkage-disequilibrium matrix, but it is still reported as an OR with a Wald-type 95% CI and p, so the check applies. These rows are null estimates unrelated to the main finding and do not affect it; the authors may wish to check them as well.
Status
- Version of record. eLife has published two versions (v1, 2022-10-17; v2, 2023-03-29). Both versions in the eLife API and the eLife article page carry the same "0.25–0.51" in the Abstract, the Results and Table 2, and a v1-to-v2 comparison shows no change to any result. I checked the v2 typeset PDF (
elife-79720-v2.pdf, downloaded from the eLife CDN) directly: the text on pages 1, 5 and 7 and the forest-plot label on page 8 read as quoted above, and the forest-plot coordinates used here come from page 8 of that file. The PMC and Europe PMC full texts agree. Every quotation above was checked verbatim against the PMC-archived text withsrc/show.py. - Supplements. Supplementary file 1 (
elife-79720-supp1-v2.docx) lists the genetic instruments: per-SNP associations with the exposures, including IGF-1. It contains no SNP–outcome associations and no MR result tables, and the article lists no source-data files, so the supplement cannot settle the interval. Recomputing the IVW estimate from scratch would need the COVID-19 Host Genetics Initiative round-5 summary statistics, which were not used here. The forest plot is the only other rendering of the IVW result in the paper. Its IVW whisker is consistent with 0.42–0.92, but because its weighted-median bar matches Table 6 rather than its own label, it cannot be treated as decisive source output. - Corrections and comments. As of 2026-10-24 I found no correction, erratum, expression of concern or retraction.
src/known.pyreturns no Crossref update relations, no PMC notices and no Europe PMC notices. The PubPeer API returned no record (HTTP 404) for the DOI, and a web search for the title together with "PubPeer" found no thread. - Sources. PMC article PMC9576268; eLife article page https://elifesciences.org/articles/79720 and its v1 and v2 API records; publisher PDF
elife-79720-v2.pdf; Supplementary file 1; Europe PMC full text; Crossref; PubPeer; https://doi.org/10.7554/eLife.79720.
Suggested correction
In the Abstract, the Results (first paragraph) and Table 2 (IGF-1, IVW, hospitalization), the interval "0.25–0.51" / "(0.25, 0.51)" should be replaced by the interval from the original IVW output. From the printed OR and p-value that interval is about 0.42–0.92, which is also where the paper's forest plot draws the IVW whisker. The exact limits should come from the authors' analysis output, not from this back-calculation. The label "0.62(0.25,0.51)" in the forest plot should be corrected to match. The authors may also wish to check the forest plot's MR-PRESSO label "0.62(0.60,0.64)" against Table 2's "0.62 (0.88, 0.43)", its weighted-median bar (drawn at Table 6's 0.45–1.24) against its label, and the Table 3 IVW p-values for hospitalization and severity against their intervals. They could also print every interval in the paper lower limit first.