← Back to the plain-language case
Abstract reports p=0.002 for an odds ratio whose own 95% CI (0.86 to 7.36) includes 1
BMJ Glob Health (2022) · doi:10.1136/bmjgh-2022-009400 · PMC9494011
Summary
The abstract reports that identifying as "gay or queer" was associated with discrimination from healthcare providers since COVID-19 ("OR=2.51, 95% CI 0.86 to 7.36, p=0.002"), and Table 3 marks the same estimate, which belongs to the queer/asexual/pansexual/questioning group (aOR 2.52), as ** (p≤0.01). The interval includes 1: reconstructing the p-value from it on the log-odds scale gives p ≈ 0.09, and p=0.002 would need an interval of about 1.40 to 4.50; the bisexual healthcare estimate (aOR 2.74, CI 0.96 to 7.81, also **) likewise gives p ≈ 0.06. These two estimates are the paper's only basis for saying that queer and bisexual respondents had higher odds of discrimination from healthcare providers, so those statements in the abstract, Results and Discussion are not supported by the paper's own intervals. The gay respondents' healthcare estimate (aOR 3.45, CI 1.23 to 9.72) does exclude 1, at p ≈ 0.02 rather than the p≤0.01 its marker indicates, so the broader finding of elevated odds for some subgroups survives.
What the paper reports
Abstract, Results:
Identifying as gay or queer was associated with increased odds of experiencing the same or more discrimination from government representatives (OR=1.89, 95% CI 1.04 to 3.45, p=0.045) and healthcare providers (OR=2.51, 95% CI 0.86 to 7.36, p=0.002) due to COVID-19.
Results, paragraph on the final (healthcare provider) adjusted model:
Sexual orientation was associated with increased odds of experiencing discrimination or violence from healthcare providers since COVID-19, with gay (OR=3.45, 95% CI 1.22 to 9.71), bisexual (OR=2.74, 95% CI 0.96 to 7.81) or queer/asexual/pansexual (OR=2.51, 95% CI 0.86 to 7.36) orientation being significantly associated.
Table 3, multivariable logistic regression. Each outcome has five columns: OR | aOR | significance marker | 95% CI lower | 95% CI upper. The outcomes are, in order, discrimination based on sexual orientation and/or gender identity, from police and/or military, from government representatives, and from health providers. Heterosexual respondents are the reference category.
Gay | 1.83 | 1.82 | * | 1.05 | 3.17 | 0.98 | 1.27 | * | 1.05 | 1.80 | 1.73 | 1.89 | * | 1.04 | 3.45 | 3.07 | 3.45 | ** | 1.23 | 9.72
Bisexual | 1.36 | 1.30 | | 0.73 | 2.28 | 0.77 | 0.72 | | 0.39 | 1.32 | 1.07 | 1.13 | | 0.61 | 2.09 | 2.58 | 2.74 | ** | 0.96 | 7.81
Queer/asexual/pansexual/questioning | 1.93 | 2.00 | * | 1.07 | 3.72 | 0.78 | 0.62 | | 0.32 | 1.19 | 1.53 | 1.30 | * | 1.21 | 2.47 | 2.91 | 2.52 | ** | 0.86 | 7.36
Table 3 footer:
*P≤0.05; **p≤0.01; ***p=0.0.
Results, paragraph on the government-representatives model:
though only a gay (OR=1.89, 95% CI 1.04 to 3.45) and queer/asexual/pansexual (OR=1.30, 95% CI 0.68 to 2.47) orientation were significant when compared with their heterosexual counterparts.
Results, paragraph on the police/military model:
Sexual orientation nor gender identity was not significantly associated with a change in odds of experiencing violence or discrimination from police and/or military.
Discussion, second paragraph:
Specifically, gay and queer/asexual/pansexual/questioning individuals had higher odds of experiencing violence and discrimination from police, government representatives and healthcare providers when compared with their heterosexual peers. Bisexual individuals also had higher odds of experiencing violence and discrimination from healthcare providers.
Methods, Statistical analyses. No other inference method, test direction or significance threshold is described:
multivariable logistic regression analyses were conducted to examine the factors associated with experiences of stigma and discrimination
Table 1. The reference category for all sexual-orientation contrasts is small:
Heterosexual | 74 | 0.95
What the paper's own numbers show
Method. For a logistic-regression odds ratio with a Wald 95% interval, the interval is symmetric on the log scale, so SE(log OR) = [ln(upper) − ln(lower)] / (2 × 1.96). Then z = ln(OR) / SE, and the two-sided p = 2·[1 − Φ(|z|)]. The geometric midpoint √(lower × upper) should reproduce the point estimate, and this checks that the OR and CI belong together. To allow for rounding, I also recomputed p over every combination of the OR and both bounds shifted by ±0.005, which is the "p range" below. The conclusion does not depend on the reconstruction method in any case: a two-sided 95% interval that contains 1 cannot go with p < 0.05.
| Quantity | Location | Reported | Recomputed from the paper's numbers |
|---|---|---|---|
| Healthcare providers, "gay or queer": OR 2.51 (0.86–7.36) | Abstract | p=0.002 | CI midpoint 2.52; SE 0.548; z 1.68; p = 0.093 (rounding range 0.091–0.095) |
| Same estimate, queer/asexual/pansexual/questioning: aOR 2.52 (0.86–7.36) | Table 3 | ** (p≤0.01) |
p = 0.091 (0.090–0.093) |
| Same estimate, 2.51 (0.86–7.36) | Results text | "significantly associated" | p = 0.093; CI includes 1 |
| 95% CI that OR 2.51 with p=0.002 would require | — | — | z 3.09; SE 0.298; 1.40 to 4.50 (the reported interval is 1.84 times wider on the log scale) |
| Same interval, read as a 90% / 99% CI | — | stated as 95% CI | p = 0.158 / 0.027 (neither is 0.002) |
| One-sided p for the same estimate | — | — | 0.046 |
| Healthcare providers, bisexual: aOR 2.74 (0.96–7.81) | Table 3; Results text | ** (p≤0.01); "significantly associated" |
p = 0.059 (0.058–0.061); CI includes 1 |
| Healthcare providers, gay: aOR 3.45 (1.23–9.72) | Table 3 | ** (p≤0.01) |
p = 0.019 (0.018–0.019): significant at 0.05, but not at the p≤0.01 the marker indicates |
| Healthcare providers, gay: OR 3.45 (1.22–9.71) | Results text | "significantly associated" | p = 0.019 (0.019–0.020) |
| Healthcare providers, lesbian: aOR 2.52 (0.50–12.87) | Table 3 | no marker | p = 0.265 (shown for comparison; consistent) |
| Government representatives, gay: aOR 1.89 (1.04–3.45) | Abstract; Table 3 | p=0.045; * |
p = 0.037 (0.036–0.039); broadly consistent |
| Government representatives, queer: aOR 1.30 (1.21–2.47) | Table 3 | * |
CI midpoint 1.73, not 1.30: the row's OR and CI cannot both be right |
| Government representatives, queer: OR 1.30 (0.68–2.47) | Results text | "significant" | CI midpoint 1.30 (coherent); p = 0.425 (0.415–0.435); CI includes 1 |
| Police/military, queer: aOR 0.62 (0.32–1.19) | Table 3 | no marker | p = 0.154; OR below 1 and not significant |
| Healthcare providers, disability: aOR 1.35 (1.07–1.71) | Abstract; Table 3 | p=0.009; ** |
p = 0.012 (0.010–0.015); consistent within rounding |
| Heterosexual reference group | Table 1 | n = 74 | 7758 − 6125 − 22 − 1158 − 379 = 74 (consistent) |
The healthcare-provider interval for the queer/asexual/pansexual/questioning group is internally coherent: its geometric midpoint (2.516) matches the reported point estimate (2.51 in the text, 2.52 in Table 3). What disagrees with the other numbers is the abstract's p-value and the table's ** marker. The same holds for the bisexual row (midpoint 2.738 against 2.74).
Figure
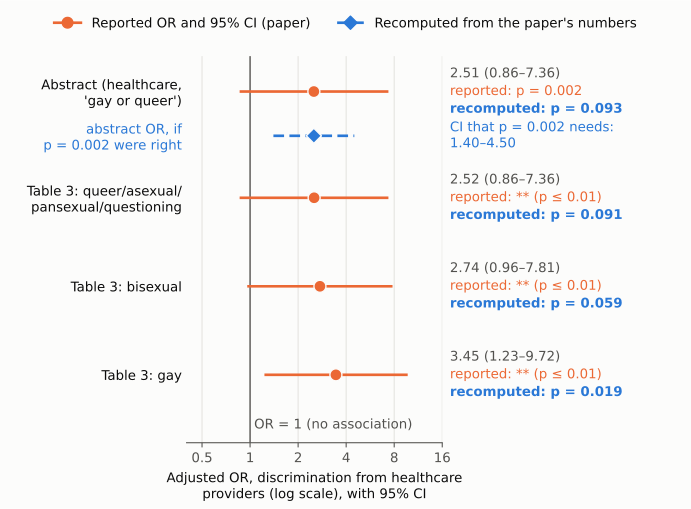
Figure 1. Adjusted odds ratios for discrimination from healthcare providers, by sexual orientation (reference: heterosexual, n = 74), on a log scale. The thin vertical line marks OR = 1. Orange dots and lines show each odds ratio and 95% CI as the paper reports it, and the orange text gives the significance the paper attaches to it (abstract p-value or Table 3 marker). Blue text gives the two-sided p recomputed from the same OR and CI with a log-scale Wald reconstruction. The dashed blue interval under the abstract row is the 95% CI (1.40–4.50) that an OR of 2.51 would need for p = 0.002 to be correct. The reported interval (0.86–7.36) is much wider and crosses 1. For the queer/asexual/pansexual/questioning and bisexual groups, the reported intervals include 1 (recomputed p = 0.09 and 0.06), although the abstract, Results text and Table 3 present them as significant at p = 0.002 or p ≤ 0.01. The gay-group interval excludes 1 (p = 0.019). All numbers come from the paper or from recompute.py.txt.
Why it matters
The abstract is the part of the paper most readers see, and it is where this estimate appears with p=0.002. At the conventional 0.05 level, the paper's own interval does not support a significant association between queer/asexual/pansexual/questioning identity and discrimination from healthcare providers. The same applies to bisexual identity (CI 0.96 to 7.81). The Discussion's statements that queer/asexual/pansexual/questioning and bisexual individuals "had higher odds" of discrimination from healthcare providers rest on these two estimates.
The abstract's wording, "gay or queer", also joins two estimates. The government figure (1.89, 1.04 to 3.45) is the gay estimate. The healthcare figure (2.51, 0.86 to 7.36) is the queer/asexual/pansexual/questioning estimate. The gay healthcare estimate is a different number (aOR 3.45, 1.23 to 9.72). A reader of the abstract cannot tell that the p=0.002 healthcare figure belongs to the 379-person queer/asexual/pansexual/questioning group rather than to gay respondents.
The same Discussion sentence also extends to police and government representatives, but the paper's other numbers do not support it for the queer group either. Its police/military aOR is 0.62 (0.32 to 1.19), and the Results state that sexual orientation was not significantly associated with police/military discrimination. Its government-representatives estimate appears as 1.30 with CI 1.21 to 2.47 in Table 3 (an interval whose midpoint is 1.73, not 1.30) and as 1.30 with CI 0.68 to 2.47 in the Results text. The text version is internally coherent and gives p ≈ 0.43.
What survives: the gay healthcare-provider estimate excludes 1 (p ≈ 0.02). So do the disability, immigrant and ethnic-minority estimates for healthcare providers in Table 3. The paper's broad finding that some marginalised subgroups reported higher odds of discrimination from healthcare providers therefore does not depend on the erroneous values. What fails is the claim of significance for the queer (and bisexual) healthcare-provider contrasts, which the abstract reports with a p-value that is over 40 times smaller than its own interval implies.
Explanations considered
- A correction already published.
known.py(Crossref, PMC and Europe PMC notices) returned nothing. Crossref shows noupdate-to,updated-byor relations. Europe PMC lists only the original article. Does not apply. - Text-conversion or extraction error. The same values appear in the abstract, the Results text and Table 3. They also appear identically in two separate renderings of the publisher's JATS full text (the PMC copy and the Europe PMC XML), where the Table 3 cells are separate elements (2.91 | 2.52 | ** | 0.86 | 7.36). Does not account for the numbers.
- The interval is not a 95% CI. Table 3 and the text both label it a 95% CI. Even read as a 99% CI, it implies p = 0.027. Read as a 90% CI, it implies p = 0.158. Neither gives 0.002. Does not account for it.
- One-sided test. The Methods never mention one-sided tests. A one-sided p from this interval is 0.046, still more than 20 times 0.002. Does not account for it.
- Unadjusted vs adjusted estimate. The abstract's 2.51 (0.86 to 7.36) matches the adjusted Table 3 row (aOR 2.52, the same interval) and not the crude OR (2.91). The p-value could belong to the crude model, but the paper reports no crude CI or p-value, and the abstract attaches p=0.002 to this OR and CI. This cannot be verified from the paper. Even if it were so, the Table 3
**on the adjusted row would still conflict with its own interval. - A global or joint test for sexual orientation. p=0.002 might be a likelihood-ratio test for the whole sexual-orientation variable. The paper does not report such a test, and the abstract presents the p-value as belonging to the single OR and CI. This would also not explain the
**on the queer and bisexual rows of Table 3. It does not reconcile the reported figures, though it cannot be excluded as the source of the number. - Wald vs profile-likelihood or exact intervals. With a reference group of only 74 heterosexual respondents, the log-OR may be somewhat skewed, and a likelihood-based interval could differ from a Wald one. But any valid two-sided 95% interval that contains 1 corresponds to p > 0.05 under the matching test. Moving p from about 0.09 to 0.002 would need an interval roughly half as wide on the log scale (1.40 to 4.50). Does not account for it.
- Multiplicity adjustment. Adjusting for multiple comparisons would make p-values larger, not smaller. Does not apply.
- The abstract's estimate is the gay estimate. The gay healthcare-provider estimate is OR 3.07 / aOR 3.45 (1.23 to 9.72; 1.22 to 9.71 in the text), with p ≈ 0.019. That is not p=0.002 either. In any case, 2.51 (0.86 to 7.36) is unambiguously the queer/asexual/pansexual/questioning row. Does not account for it.
- Rounding. Over every combination of the OR and the bounds shifted by ±0.005, p stays between 0.091 and 0.095. Does not account for it.
Status
As of 2026-10-23:
- Version of record. The publisher site (gh.bmj.com, reached through the doi.org redirect) returned HTTP 403 to automated access, and the PMC web page served only a browser check. I therefore checked the publisher-supplied JATS full text archived at Europe PMC (fullTextXML for PMC9494011). It matches the local PMC copy in the abstract sentence, the Results sentence and the Table 3 cells quoted above, so the error is in the version of record as archived.
- Supplementary material. None. The JATS has no supplementary-material elements, and Europe PMC reports hasSuppl = N. The data availability statement says data are available on reasonable request, at the discretion of the partner social networking company. No public data or output can settle whether the p-value, the marker or the interval is the wrong value.
- Corrections and notices. None found. I checked Crossref (
update-to,updated-by,relation: none), Crossref's Retraction Watch-derived update data (none), PMC and Europe PMC notices (none; Europe PMC search on the DOI returns only PMID 36130772), and a web search for a correction or erratum (no notice for this article). - PubPeer. The PubPeer API required human verification and could not be queried directly. Web searches found no PubPeer thread for this DOI. PubPeer is therefore not confirmed.
Suggested correction
- Abstract, Results: report the healthcare-provider estimate with a p-value consistent with its interval (about p=0.09 if the interval 0.86 to 7.36 is correct), and do not describe the association as significant. Alternatively, if the interval is the wrong value, give the correct one. Attribute each estimate to the right group: the government estimate (1.89, 1.04 to 3.45) is for gay respondents, and the healthcare estimate (2.51, 0.86 to 7.36) is for queer/asexual/pansexual/questioning respondents. If the abstract is meant to describe gay respondents' healthcare-provider estimate, that is aOR 3.45 (95% CI 1.23 to 9.72), p ≈ 0.02.
- Table 3, health-provider columns: remove the
**markers from the queer/asexual/pansexual/questioning row (CI 0.86 to 7.36) and the bisexual row (CI 0.96 to 7.81), and change the gay row's**to*(CI 1.23 to 9.72, p ≈ 0.02), unless the authors' output shows different intervals. - Table 3, government-representatives columns, queer/asexual/pansexual/questioning row: reconcile the lower bound (1.21 in the table vs 0.68 in the text) and the
*marker with the OR of 1.30. - Results (healthcare-provider and government-representatives paragraphs) and Discussion: restate which sexual-orientation groups had intervals excluding 1, specifically that the queer/asexual/pansexual/questioning and bisexual healthcare-provider estimates, and the queer police and government estimates, were not statistically significant at the 0.05 level.
- Methods: state how p-values and confidence intervals were computed (Wald or likelihood-based, two-sided) and the significance threshold used.