← Back to the plain-language case
Abstract's risk-factor-adjusted hazard ratios for three fat measures match a BMI-adjusted supplementary model, not Table 2
BMC Med (2022) · doi:10.1186/s12916-022-02505-y · PMC9484252
Summary
The abstract says that "after adjustments for cardiovascular risk factors", total fat mass, gynoid fat mass and the android-to-gynoid fat ratio had hazard ratios for new-onset atrial fibrillation (AF) of 1.33 (1.05–1.68), 1.36 (1.12–1.65) and 0.81 (0.70–0.94). Table 2 (Model 2) and the Results text describe the same adjustment, and both give 1.22 (1.09–1.36), 1.26 (1.13–1.41) and 0.85 (0.74–0.98). The three abstract values match exactly, to every printed digit, the Model 2 column of Supplementary Table S6, which adds body mass index (BMI) to the cardiovascular-risk-factor model. The fourth estimate in the same abstract sentence, epicardial fat at 1.27 (1.09–1.48), comes from the model without BMI. So the abstract labels two different models with one description. As a result it overstates the risk-factor-adjusted hazard ratios for total and gynoid fat by about 8–9% and gives intervals 1.75 to 2.1 times wider than the model it names. No direction or significance changes, and the paper's lean-mass-adjusted results and its conclusions are not affected.
What the paper reports
Abstract, Results, second sentence:
After adjustments for cardiovascular risk factors, absolute fat mass (HR; 95% CI 1.33; 1.05–1.68), gynoid fat mass (HR; 95% CI 1.36; 1.12–1.65), epicardial fat mass (HR; 95% CI 1.27; 1.09-1.48), and android-to-gynoid fat ratio (HR; 95% CI 0.81; 0.70-0.94) were independently associated with new-onset AF.
Abstract, Results, third sentence:
After further adjustment for lean mass, associations between fat mass (HR; 95% CI 1.17; 1.04-1.32), gynoid fat mass (HR; 95% CI 1.21; 1.08–1.37), and android-to-gynoid fat ratio (HR; 95% CI 0.84; 0.72–0.97) remained statistically significant.
Methods, Statistical analysis, which defines the model the abstract describes:
Model 2 was additionally adjusted for cardiovascular risk factors including total and HDL cholesterol, history of hypertension, history of diabetes mellitus (DM), history of coronary heart disease (CHD), history of heart failure (HF), history of left ventricular hypertrophy, smoking status, total alcohol intake, use of lipid-lowering medication, and use of cardiac medication. Moreover, we additionally adjusted for total lean mass in Model 3 and for total fat mass in Model 4, respectively.
Results, "Association of different fat depots with incident AF":
After adjustment for cardiovascular risk factors (model 2), higher levels of fat depots were significantly associated with new-onset AF with the exception for liver fat. The multivariable-adjusted HRs and 95% CIs were 1.22 (1.09–1.36) for fat mass, 1.14 (1.03–1.27) for android mass, 1.26 (1.13–1.41) for gynoid fat mass, and 1.27 (1.09–1.48) for epicardial fat. Notably, android-to-gynoid fat mass ratio showed an inverse association with incident AF [0.85 (0.74–0.98)].
Table 2 ("Associations between various DXA-based fat depots and incident atrial fibrillation", N = 3468), columns Model 1 | Model 2 | Model 3 | Model 4:
Total fat mass | 1.28 (1.15–1.42) | 1.22 (1.09–1.36) | 1.17 (1.04–1.32) | –
Gynoid fat mass | 1.31 (1.18–1.46) | 1.26 (1.13–1.41) | 1.21 (1.08–1.37) | 1.36 (0.96–1.93)
Android-to-gynoidfat ratio | 0.93 (0.81–1.06) | 0.85 (0.74–0.98) | 0.84 (0.72–0.97) | 0.82 (0.70–0.95)
Table 3 (CT-based), Model 2 column:
Epicardial fat | 1.31 (1.13–1.51) | 1.27 (1.09–1.48) | 1.16 (0.95–1.42) | 1.09 (0.87–1.38)
Additional file 1, Table S6, "Associations between various fat depots and incident atrial fibrillation, adjusting for body mass index and waist-to-hip ratio", columns Model 1 | Model 2 | Model 3 (text taken from the supplementary .docx; hyphens as printed there):
Total fat mass | 1.22 (1.09-1.36) | 1.33 (1.05-1.68) | 1.27 (1.13-1.42)
Gynoid fat mass | 1.26 (1.13-1.41) | 1.36 (1.12-1.65) | 1.29 (1.15-1.44)
Android-to-gynoid fat ratio | 0.85 (0.74-0.98) | 0.81 (0.70-0.94) | 0.77 (0.65-0.91)
Epicardial fat | 1.27 (1.09-1.48) | 1.18 (0.99-1.41) | 1.32 (1.11-1.57)
Table S6 footnote, excerpt:
Model 1 was adjusted for age, high-density lipoprotein cholesterol, total cholesterol, smoking, total alcohol intake, lipid lowering medication and cardiac medication, history of hypertension, left ventricular hypertrophy, diabetes mellitus, heart failure and coronary heart disease. Model 2: Model 1 + body mass index. Model 3: Model 1 + waist-to-hip ratio.
Discussion, "Study strengths and limitations", which cites Table S6:
Of note, findings indicated a robust and independent association between gynoid fat and android-to-gynoid fat ratio with AF after adjusting for BMI, WHR, or total lean mass, (Additional file 1: Table. S6)
What the paper's own numbers show
Method. I matched each hazard ratio (95% CI) in the abstract's "after adjustments for cardiovascular risk factors" sentence against every column of Tables 2 and 3 and of Supplementary Table S6. Assuming Wald intervals on the log scale, I took the implied standard error of each log hazard ratio as SE = [ln(upper) − ln(lower)] / (2 × 1.96). To make sure the differences are not a rounding effect, I also bounded each SE by moving the printed limits ±0.005. Finally, as a rough benchmark, I compared each SE with the precision the event count allows: for a standardized exposure, SE ≈ 1/√events. Every number below is printed by recompute.py.txt.
| Quantity | Location | Reported | Recomputed from the paper's own numbers |
|---|---|---|---|
| Total fat mass, adjusted for CV risk factors | Abstract vs Table 2 Model 2 and Results | 1.33 (1.05–1.68) vs 1.22 (1.09–1.36) | Differ by +0.11 (+9.0%). Abstract equals Table S6 Model 2 (+BMI) exactly |
| Gynoid fat mass, adjusted for CV risk factors | Abstract vs Table 2 Model 2 and Results | 1.36 (1.12–1.65) vs 1.26 (1.13–1.41) | Differ by +0.10 (+7.9%). Abstract equals Table S6 Model 2 (+BMI) exactly |
| Android-to-gynoid ratio, adjusted for CV risk factors | Abstract vs Table 2 Model 2 and Results | 0.81 (0.70–0.94) vs 0.85 (0.74–0.98) | Differ by −0.04 (−4.7%). Abstract equals Table S6 Model 2 (+BMI) exactly |
| Epicardial fat, same abstract sentence | Abstract vs Table 3 Model 2 | 1.27 (1.09–1.48) vs 1.27 (1.09–1.48) | Identical. Table S6 Model 2 (+BMI) gives 1.18 (0.99–1.41), p ≈ 0.067 |
| Table S6 Model 1 vs Table 2/3 Model 2 | Supplement vs main tables | 1.22, 1.26, 0.85, 1.27 with the same CIs | Identical for all four, so S6 Model 1 is the main-text Model 2 |
| Implied SE of log HR, total fat | Abstract vs Table 2 Model 2 | — | 0.120 vs 0.056. Ratio 2.12 (2.01–2.24 allowing for rounding) |
| Implied SE of log HR, gynoid fat | Abstract vs Table 2 Model 2 | — | 0.099 vs 0.056. Ratio 1.75 (1.66–1.85) |
| Implied SE of log HR, A/G ratio | Abstract vs Table 2 Model 2 | — | 0.075 vs 0.072. Ratio 1.05 (0.96–1.14) |
| Benchmark SE for 395 events | Abstract and Results (395 AF cases, DXA) | — | 1/√395 = 0.050. Table 2 Model 2 SE 0.056 implies variance inflation of 1.26. Abstract SE 0.120 implies 5.68, which fits adding a covariate as collinear as BMI |
| Abstract values in any Table 2 column | Table 2, Models 1–4 | — | No exact match. Only the gynoid point estimate 1.36 recurs, in Model 4, with CI 0.96–1.93 |
| Lean-mass-adjusted values | Abstract vs Table 2 Model 3 | 1.17 (1.04–1.32); 1.21 (1.08–1.37); 0.84 (0.72–0.97) | Identical in both places |
All three discordant abstract estimates reproduce the corresponding Table S6 Model 2 (+BMI) entries digit for digit. Their intervals are internally consistent: the geometric midpoints are 1.328, 1.359 and 0.811. Their widths are the ones expected after adding BMI, a covariate strongly correlated with total and gynoid fat. The SE for total fat roughly doubles, from 0.056 to 0.120, which no rounding of two-decimal limits can produce. The abstract sentence therefore reports three estimates from the BMI-adjusted model and one from the model without BMI, and describes all four with the wording that the Methods and Results use for Model 2.
Figure
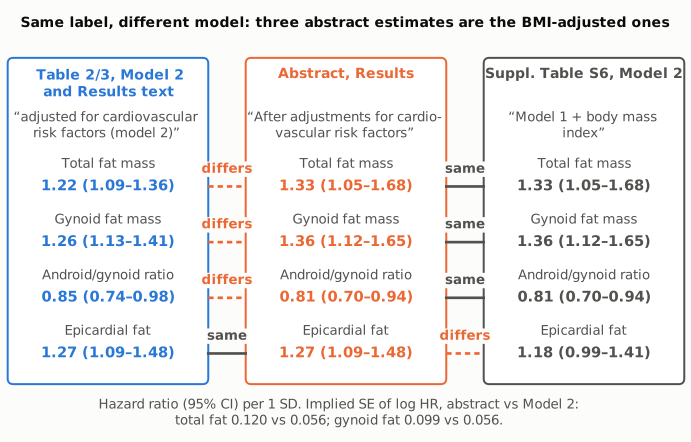
Figure 1. Three panels give the hazard ratios (95% CI) per 1 SD for the four fat measures in the abstract's "after adjustments for cardiovascular risk factors" sentence. Centre (orange): the abstract. Left (blue): Table 2/Table 3 Model 2 and the Results text, which the Methods define as the cardiovascular-risk-factor model. Right (dark grey): Supplementary Table S6 Model 2, which is that model plus body mass index. Each connector is labelled "same" (solid) or "differs" (dashed). For total fat mass, gynoid fat mass and the android-to-gynoid ratio, the abstract differs from Table 2 and equals Table S6 Model 2 exactly. For epicardial fat, the abstract equals Table 3 and differs from Table S6 Model 2.
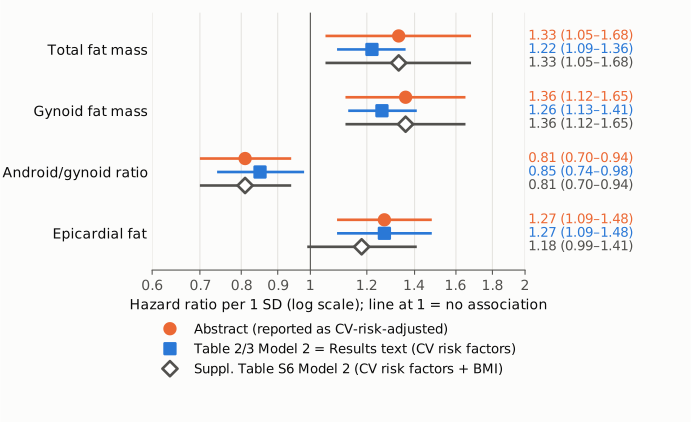
Figure 2. The same estimates on one log-scale hazard-ratio axis, with a thin reference line at 1 (no association). Orange circles: abstract. Blue squares: Table 2/3 Model 2 (cardiovascular risk factors). Dark grey open diamonds: Table S6 Model 2 (cardiovascular risk factors + BMI). Each value is also printed at the right. For total and gynoid fat the abstract interval lies exactly on the BMI-adjusted one, and it is about twice as wide on the log scale as the Model 2 interval. For epicardial fat the abstract lies on Model 2, and the BMI-adjusted interval would cross 1. All estimates stay on the same side of 1 in every model except BMI-adjusted epicardial fat.
Why it matters
- The abstract misstates the size and precision of a named model. A reader of the abstract would take 1.33 and 1.36 as the risk-factor-adjusted hazard ratios per SD of total and gynoid fat. The model the paper defines with those words gives 1.22 and 1.26, with intervals about half as wide on the log scale. Anyone who pools or compares effect sizes from the abstract, for example in a meta-analysis of fat mass and AF, would carry over the wrong estimate and the wrong variance. The abstract SE for total fat is 2.1 times the Model 2 SE, so the inverse-variance weight would be about 4.5 times too small.
- One sentence mixes two models. Under the BMI-adjusted model that supplies three of its four numbers, epicardial fat would be 1.18 (0.99–1.41). That interval includes 1, so the sentence's claim that all four depots "were independently associated with new-onset AF" holds only because epicardial fat is taken from the other model.
- The headline conclusions are unaffected. The corrected Model 2 estimates keep the same direction and all remain significant (p ≈ 0.0004, < 0.0001 and 0.023). The abstract's lean-mass-adjusted estimates match Table 2 Model 3. Its other results (body fat score 1.10, subcutaneous-pattern 1.21) are not involved. Table S6 itself, cited in the Discussion, supports associations of total fat, gynoid fat and the ratio after BMI adjustment. The BMI-adjusted results are therefore legitimate analyses of the paper. The error is that the abstract labels them as the cardiovascular-risk-factor model.
- Side observation. The abstract's Conclusions say "Total fat mass and gynoid fat mass were independently associated with AF after adjustment for body size". The main-text Conclusions say only "Gynoid fat mass was independently associated with AF after taking body size into account." Both versions are supported by the paper's Model 3 or Table S6 estimates, and this difference is not part of the numerical finding above.
Explanations considered
- Rounding or transcription noise. Ruled out. The three abstract estimates differ from Model 2 by 0.04 to 0.11 on the HR scale, and their intervals are not compatible: allowing for two-decimal rounding of the limits, the SE ratio is 2.01–2.24 for total fat and 1.66–1.85 for gynoid fat. Every digit of all three values equals a single other column of the paper, which noise would not produce.
- A different column of Table 2 (Model 1, 3 or 4). Ruled out. None of Models 1–4 gives any of the three hazard ratio–CI pairs. The gynoid point estimate 1.36 also appears in Model 4, but there its interval is 0.96–1.93, not 1.12–1.65, and Model 4 is not described as the cardiovascular-risk-factor model.
- A subgroup or sensitivity analysis described elsewhere as risk-factor-adjusted. Ruled out as the source. Table S3, the analysis excluding prevalent cardiovascular disease, gives 1.23 (1.08–1.40), 1.27 (1.11–1.45) and 0.84 (0.71–0.99) for Model 2. A text search of the whole supplement finds each of the three abstract hazard ratio–CI pairs exactly once, so the sex- and BMI-stratified results do not match either. The only exact match is Table S6 Model 2, whose footnote defines it as "Model 1 + body mass index".
- "Cardiovascular risk factors" was meant to include BMI. Not supported by the paper's own definitions. The Methods list of Model 2 covariates, and the footnotes of Tables 2, 3 and 4, do not include BMI. The Results text gives the non-BMI values under the same wording. The abstract's epicardial estimate in the same sentence is the non-BMI value. Table S6 itself sets "+ body mass index" apart from the risk-factor model.
- A conversion or typesetting artifact. Ruled out. The same abstract numbers appear on the PMC page, in the Europe PMC full-text XML (the publisher's JATS file), and in the abstract on the publisher's springermedicine.com platform (see Status). In the JATS file the Table 2 cells sit in their expected columns.
- A correction already issued. None found (see Status).
Status
- Version of record. As of 2026-10-24. The publisher's article page (doi.org → bmcmedicine.biomedcentral.com → link.springer.com) redirected automated requests to a sign-in page, and the publisher's PDF links returned a challenge page instead of a PDF. Three copies of the published text were compared instead, and all carry the numbers quoted here: (1) the PMC page for PMC9484252; (2) the Europe PMC full-text JATS XML (publication date 19 September 2022); (3) the abstract on springermedicine.com. Every quotation from the article was checked verbatim against the PMC-archived text with
src/show.py. - Supplements. Additional file 1 (
12916_2022_2505_MOESM1_ESM.docx, the only supplementary file, from static-content.springer.com) was downloaded and its text extracted. Tables S3 and S6 are quoted or summarized above. S6 Model 1 reproduces the main-text Model 2 for every depot, and S6 Model 2 (+BMI) supplies the three discordant abstract values. The supplement explains where the abstract numbers come from, but it does not remove the mislabelling in the abstract. - Corrections and comments. I found no correction, erratum, retraction or expression of concern.
src/known.pyreturns no Crossref update relations, no PMC notices and no Europe PMC notices. The Crossref record has no update-to or updated-by entry and an empty relation field. The Europe PMC record (PMID 36117169) has no comment or correction links. The PubPeer API returned no record (HTTP 404) for the DOI, and a web search for the title with "PubPeer" found no thread. - Sources. PMC article PMC9484252; Europe PMC full-text XML and record; Additional file 1 from static-content.springer.com; springermedicine.com abstract page; Crossref; PubPeer; https://doi.org/10.1186/s12916-022-02505-y.
Suggested correction
In the abstract, either report the Model 2 estimates that the stated adjustment refers to:
After adjustments for cardiovascular risk factors, absolute fat mass (HR; 95% CI 1.22; 1.09–1.36), gynoid fat mass (HR; 95% CI 1.26; 1.13–1.41), epicardial fat mass (HR; 95% CI 1.27; 1.09–1.48), and android-to-gynoid fat ratio (HR; 95% CI 0.85; 0.74–0.98) were independently associated with new-onset AF.
or, if the BMI-adjusted estimates are intended, label them as such, for example "After adjustment for cardiovascular risk factors and body mass index, absolute fat mass (HR 1.33; 1.05–1.68), gynoid fat mass (HR 1.36; 1.12–1.65) and android-to-gynoid fat ratio (HR 0.81; 0.70–0.94) …". In that case the epicardial fat estimate from the same model, 1.18 (0.99–1.41), should replace 1.27 (1.09–1.48) or be reported separately. Nothing in Tables 2–4, the Results text or the supplement needs to change.