← Back to the plain-language case
Abstract reports 18 PDX models for the co-clinical trial; the paper's data contain 15
Cancer Res (2022) · doi:10.1158/0008-5472.CAN-22-0198 · PMC9478530
Summary
The abstract says the combination of MEK and CDK4/6 inhibition was tested "across 18 PDX models" and that 60% of tumors regressed, meeting the co-clinical trial's primary endpoint. Every other count in the paper gives 15 models. The Results subgroups add up to 6 + 2 + 3 + 4 = 15, the Results report "9 of 15 models (60%)", the Fig. 1 legends say 15 models, and Supplementary Tables S1 and S3 each list the same 15 model IDs. Every model used in the later experiments is one of those 15. Of the two counts, only 15 gives exactly 60% (9/15); with 18 the nearest values are 55.6% (10/18) and 61.1% (11/18), 60% of 18 is 10.8 models, and the 9 responders reported in the Results give 50%. The response rate and the "endpoint met" conclusion hold at 9 of 15. What the abstract gets wrong is the size of the evidence base: it overstates it by 3 models (20%), and it sits in the place readers and meta-analysts most often take sample sizes from.
What the paper reports
Abstract:
Across 18 PDX models undergoing dual inhibition of MEK and CDK4/6, 60% of tumors regressed, meeting the co-clinical trial primary endpoint.
Results, "Combined inhibition of MEK and CDK4/6 in colorectal cancer PDX models", first paragraph:
we evaluated typical RAS models that include a mixture of exon 2 KRASG12/13 (n = 6) P-loop domain mutated PDX models, extended RAS models that include NRASQ61 switch II domain mutated tumors (n = 2) along with KRASA146T nucleotide exchange promoting domain mutated tumors (n = 3; refs. 23, 24), and wild-type RAS tumors (n = 4).
Results, same section, second paragraph:
The PDX co-clinical trial of MEK (trametinib) and CDK4/6 (palbociclib) inhibition met its prespecified primary endpoint of tumor regression of ≥30% in more than 30% of the models. As shown in Fig. 1B and C, the combination of MEK and CDK4/6 inhibition produced ≥30% regression in 9 of 15 models (60%) with significantly greater tumor growth inhibition when compared with single agent–treated PDXs.
Figure 1 legend, panels A to D:
Six PDX models harboring codon 12 or 13 (“typical” RAS), 5 with codons 61 or 149 mutations (“extended” RAS), and 4 wild-type RAS PDX models were analyzed by RPPA
Trametinib (0.25 mpk, daily; green), palbociclib (75 mpk, daily; blue), and their combination (red) were evaluated in 15 mCRC PDX models.
C, Waterfall representation of 15 PDX models’ responses, per PDX model results.
D, Effect of treatments on mice body weight. Right, Tukey plot, after 21 days of treatment. Summarized data for 15 PDX models.
Results, "Mechanisms of acquired resistance":
Intriguingly, elevated phospho-SHP2 level was detected in 11 of 15 PDX models treated with the combination
Materials and Methods, "In vivo studies and PDXs":
PDX model details are provided in Supplementary Table S1.
Discussion, first paragraph:
The co-clinical trial met its primary endpoint of demonstrating tumor regressions in greater than 30% of models
What the paper's own numbers show
Method. I added up the RAS subgroup counts given in the Results text and in the Fig. 1A legend. I then built the list of PDX model IDs from Supplementary Table S1 (sheet "PDX details"), Supplementary Table S3 (the ranking of combination responses, grouped by RAS status), and the Fig. 1B panel titles. I added every model named for the follow-on experiments: the dose study (Fig. 2, Supp. Table S6), the durability cohort (Fig. 4, Supp. Table S7), the SHP2 triple combination (Fig. 5) and Supp. Fig. S2. Last, I checked which denominators can produce the abstract's 60%. Every number below is printed by recompute.py.txt.
| Quantity | Location | Reported | Recomputed from the paper's numbers |
|---|---|---|---|
| PDX models given MEK + CDK4/6 inhibition | Abstract | 18 | 15; no set of 18 models appears anywhere in the paper or supplement |
| RAS subgroups, text | Results, paragraph 1 | n = 6, 2, 3, 4 | 6 + 2 + 3 + 4 = 15 |
| RAS subgroups, figure legend | Fig. 1A legend | 6 typical, 5 extended, 4 wild type | 6 + 5 + 4 = 15; the text's 2 + 3 = 5 extended models match |
| Models in the co-clinical trial | Results, paragraph 2; Fig. 1B–D legends | "9 of 15 models"; "15 mCRC PDX models" | 15 |
| Model panels | Fig. 1B | – | 15 |
| Model rows | Supp. Table S1 ("PDX details") | – | 15 unique IDs |
| Model rows by RAS group | Supp. Table S3 | – | 15 (6 typical, 5 extended, 4 wild type); same IDs as S1 and Fig. 1B |
| Models in follow-on experiments | Figs. 2, 4, 5; Supp. Fig. S2; Supp. Tables S6, S7 | 3, 8, 2 and 2 models | 9 distinct models, 0 outside the 15 |
| All distinct models named anywhere | Paper and supplement | – | 15, so 18 − 15 = 3 models are unaccounted for |
| Durability cohort | Results; Fig. 4 | "eight PDX models (4 of each RASmut subtype)" | 8, all among the 15 (4 typical, 4 extended) |
| Regression rate, 15 models | Abstract; Results | 60%; "9 of 15 models (60%)" | 9/15 = 60.0% |
| Same 9 responders over 18 models | – | – | 9/18 = 50.0% |
| Responders implied by 60% of 18 | Abstract | 60% | 0.6 × 18 = 10.8, not a whole number; 10/18 = 55.6%, 11/18 = 61.1% |
| Values of k for which k/n rounds to 60% | – | – | n = 15: k = 9 only; n = 18: none |
| Primary endpoint (more than 30% of models with ≥30% regression) | Results | met | 9/15 = 60% > 30%. Exact one-sided binomial test against 30% (my calculation; the paper reports no test): P = 0.015. Clopper–Pearson 95% CI 32.3% to 83.7%, one-sided 95% lower bound 36.0% |
Figure
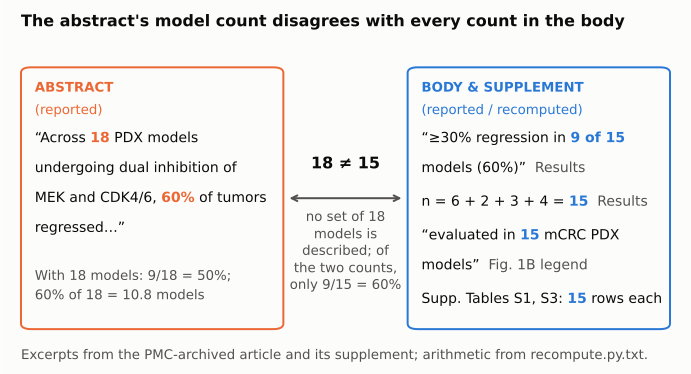
Figure 1. Two text panels hold short excerpts from the article as archived in PMC. The left panel (orange, the value reported in the abstract) gives the abstract's sentence with its count of 18 models and its 60% response rate. The right panel (blue, counts found in or recomputed from the paper's own body and supplement) gives the Results' "9 of 15 models (60%)", the Results' subgroup counts, which add up to 15, the Fig. 1B legend's "15 mCRC PDX models", and the 15 rows in each of Supplementary Tables S1 and S3. The connector names the conflict: no set of 18 models is described anywhere in the paper, and of the two counts only 15 gives exactly 60% (9/15). The arithmetic is in recompute.py.txt.
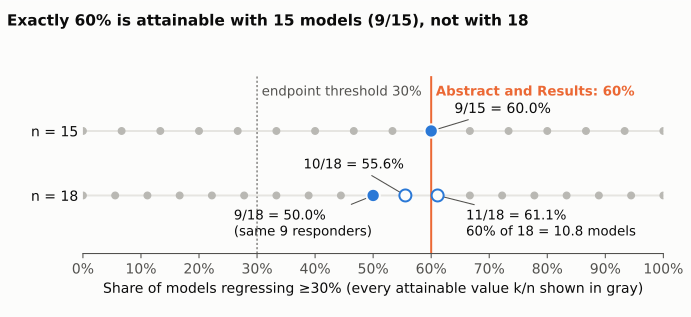
Figure 2. Each gray dot is a response rate that can occur with n models (k/n, k = 0 to n), on a full 0–100% axis. The orange vertical line marks the 60% reported in both the abstract and the Results. The dotted line marks the primary endpoint's 30% threshold. With n = 15, 60% falls exactly on 9/15 (filled blue). With n = 18, no attainable value equals 60%: the same 9 responders give 9/18 = 50.0% (filled blue), and the two nearest values are 10/18 = 55.6% and 11/18 = 61.1% (open blue). Of the two counts in the paper, the reported 60% therefore matches the 15-model denominator exactly, and not the 18 stated in the abstract.
Why it matters
The abstract is the only place in the paper that says 18, and the abstract is where readers, indexers and meta-analysts usually take the number of models. Anyone counting PDX models across preclinical studies of MEK plus CDK4/6 inhibition, or citing this study as an example of a co-clinical trial design, would record 3 models (20%) that the paper does not document.
The efficacy conclusion is unaffected. The correct figure is 9 of 15 models with at least 30% regression (60%), well above the prespecified 30% threshold. The exact 95% interval for 9/15 runs from 32.3% to 83.7%. A reader who combined the abstract's 18 with the 9 responders given in the Results would get 50%, which still exceeds the 30% threshold but does not match the abstract's own 60%. The subgroup comparisons (typical vs. extended RAS, TP53, CMS) already rest on small groups, and the 15-model count is the right basis for judging them.
Explanations considered
- A wider set of models, such as the co-clinical trial plus the dose, durability or SHP2 experiments. This does not explain the 18. The models in Fig. 2 and Supp. Table S6 (C1138, B1011, C1174), Fig. 4 and Supp. Table S7 (8 models: C1138, C1047, B8093, B1011, B1008, F3008, C1012, C0997), Fig. 5 (B1008, F3008) and Supp. Fig. S2 (F3008, B1011) are all among the 15. The union of every model named in the paper and supplement is 15.
- A different unit, such as tumors or mice instead of models. This does not fit. The abstract says "18 PDX models" outright. Fig. 1B reports n = 6–9 tumors per arm for each model, so a count of tumors would be roughly 90 to 135 in the combination arm alone (15 models × 6–9 tumors), not 18.
- Another denominator that gives 60%. Not with 18. 0.6 × 18 = 10.8 is not a whole number, and no k/18 rounds to a whole-percent 60% (10/18 = 55.6%, 11/18 = 61.1%). Other denominators such as 5, 10 or 20 could give exactly 60%, but no such model count appears in the paper. Of the two counts the paper gives, only 15 yields exactly 60% (9/15), which is what the Results report.
- Models in the supplement that the main text omits. Supplementary Table S1 (PDX details) and Supplementary Table S3 (response ranking) each list exactly 15 models, with the same IDs as the 15 panels of Fig. 1B, split 6 typical, 5 extended and 4 wild type. The Supplementary Materials and Methods describe no other cohort.
- A text-conversion or archiving artifact. Ruled out. "18" is a spelled-out integer in running text, so it cannot be a lost sign, a misread superscript or a shifted table cell. The same wording appears on the live PMC page, in the Europe PMC full-text XML, in the PubMed abstract (PMID 35913398), and in the abstract on the publisher's figshare collection for the article.
- A later correction. None found (see Status).
- Side observation, not part of the claim. The Fig. 1A legend describes the extended group as "codons 61 or 149", while the Results text names KRAS A146T. The Fig. 1B panel titles label the three KRAS codon-146 models as B1011 A146T, C1151 A146T and C1012 A146V, so the text's "KRASA146T (n = 3)" is also slightly off. None of this changes any count: the 5 extended models equal the text's 2 NRAS Q61 plus 3 KRAS codon-146 models.
Status
As of 2026-10-23:
- Version of record. The publisher page (aacrjournals.org, Cancer Res 82(18):3335) and its PDF returned HTTP 403 to automated access and could not be read directly. The abstract sentence with "18" and the Results' "9 of 15 models (60%)" are identical on the live PMC page (PMC9478530), in the Europe PMC full-text XML, in the PubMed record (PMID 35913398) and in the abstract on AACR's figshare collection for the article (doi:10.1158/0008-5472.c.6513959). The figshare collection is published by the journal, so the error is very likely in the version of record too.
- Supplements. I took the full supplementary package (Figures S1–S5, Supplementary Materials and Methods, Tables S1–S9) from Europe PMC's supplementaryFiles endpoint and read Table S1, Table S3, Table S6 ("Results of alternative trametinib/palbociclib regimens study"; models C1138, B1011 and C1174), Table S7 ("TP53 mutational status in mCRC PDX models") and the Supplementary Materials and Methods. All are consistent with 15 models, as described above.
- Corrections. Crossref has no update-to or updated-by relations for the DOI. PMC and Europe PMC list no erratum, correction, expression of concern or retraction.
- PubPeer. The PubPeer publications API, queried with the DOI, returned no comments, and a web search found no PubPeer thread for the article.
Suggested correction
In the abstract, replace "Across 18 PDX models undergoing dual inhibition of MEK and CDK4/6, 60% of tumors regressed" with "Across 15 PDX models undergoing dual inhibition of MEK and CDK4/6, 9 (60%) regressed". This brings the abstract in line with the Results, the Fig. 1 legends and Supplementary Tables S1 and S3. The journal could also check the Fig. 1A legend's "codons 61 or 149" and the Results' "KRASA146T (n = 3)" against the Fig. 1B panel labels, which show two A146T models and one A146V model.