← Back to the plain-language case
Results text swaps BA.1 and BA.2 predicted vaccine effectiveness relative to Abstract and Fig. 4a
Nat Med (2022) · doi:10.1038/s41591-022-01877-1 · PMC9388371
Summary
The paper predicts mRNA-vaccine effectiveness (VE) against symptomatic infection for four Omicron sublineages, all from the same model (Fig. 4a). The Abstract says predicted VE ranged from 11.9% to 33.3%, highest against BA.1 and lowest against BA.2. The Results sentence that introduces Fig. 4a gives "11.9% for BA.1 and 33.3% for BA.2", which reverses that order. Measured against the axis ticks, the mRNA bars in Fig. 4a are 33.3% for BA.1 and 11.9% for BA.2, so the figure agrees with the Abstract and the Results sentence has the two lineage labels swapped. Anyone who reads only the Results text gets the direction of the BA.1 versus BA.2 comparison backwards, by 21.4 percentage points.
What the paper reports
Abstract:
Among the four sublineages of Omicron, the predicted VE varied between 11.9% and 33.3%, with the highest VE predicted against BA.1 and the lowest against BA.2, using the mRNA vaccine platform.
Results, section "Prediction for variants and Omicron sublineages without known VEs", first paragraph:
Next, we fitted the model with all available data and predicted VE against circulating variants as well as the Omicron sublineages for which there are no observed VE data at the time of writing (Fig. 4a). Interestingly, among the four sublineages of Omicron (BA.1, BA.1.1, BA.2 and BA.3), the expected VEs vary between 11.9% for BA.1 and 33.3% for BA.2, using the mRNA vaccines.
The same paragraph goes on:
This might contribute to the considerable variations in VEs for Omicron reported from observational studies, whose cohorts might have been infected by divergent Omicron sublineages, in addition to differences in immune history.
Fig. 4 legend, panel a:
Predicted VEs for specific variants/sublineages without observed VEs. Omicron sublineages: BA.1, BA.1.1, BA.2 and BA.3.
Fig. 4a is a bar chart titled on its y-axis "Estimated COVID-19 VE (%)". It has one bar per platform (mRNA, protein subunit, inactivated, viral vector) for each of 12 variants. Neither the text nor the supplement prints the plotted values.
What the paper's own numbers show
Method. Both statements describe the same quantity: predicted mRNA-platform VE from the model fitted to all data, for the same four sublineages. Both give the same two endpoints, 11.9% and 33.3%, and differ only in which lineage gets which value. To settle which pairing the model produced, I measured the mRNA bars in Fig. 4a of the version of record, using the publisher's full-resolution image (1557 × 1721 px). I calibrated the y-axis from the six tick marks from 0 to 100 (5.453 px per percentage point, largest tick residual 0.04 pp). For each bar, I located the top edge to sub-pixel precision from the anti-aliased boundary row. Two baseline conventions, the 0 tick or the bar's bottom edge, change the readings by at most 0.2 pp. recompute.py.txt holds the recorded pixel positions and prints every number below. Given the image path, it re-measures them from the image.
| Quantity | Location | Reported | Recomputed (Fig. 4a) |
|---|---|---|---|
| mRNA VE, BA.1 | Results | 11.9% | 33.3% |
| mRNA VE, BA.2 | Results | 33.3% | 11.9% |
| mRNA VE, BA.3 | Fig. 4a only | not stated | 17.5% |
| mRNA VE, BA.1.1 | Fig. 4a only | not stated | 12.5% |
| Sublineage with highest mRNA VE | Abstract | BA.1 | BA.1 |
| Sublineage with lowest mRNA VE | Abstract | BA.2 | BA.2 |
| Range across the four sublineages | Abstract and Results | 11.9% to 33.3% | 11.9% to 33.3% |
| BA.1 minus BA.2 | Results (implied) vs Abstract (positive) | −21.4 pp | +21.4 pp |
The figure's BA.1 and BA.2 bars match the Results' two values to within 0.02 pp, but paired with the opposite lineages. The range and the Abstract's ordering are both consistent with the figure. The only discrepancy is the pairing in the Results sentence.
Figure
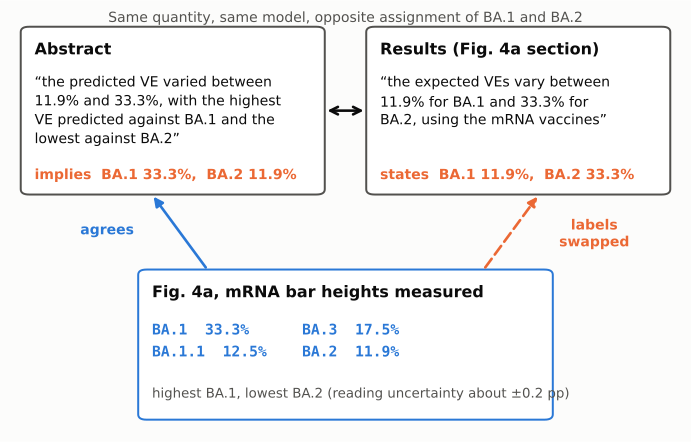
Figure 1. The two text passages that report the predicted mRNA VE for Omicron sublineages, quoted from the version of record (top). The orange lines give the pairing that each passage states or implies. The bottom panel gives the mRNA bar heights measured from Fig. 4a of the same paper (blue; reading uncertainty about ±0.2 pp). The Abstract's ordering (BA.1 highest, BA.2 lowest) agrees with the figure. The Results sentence attaches the same two numbers to the opposite lineages.
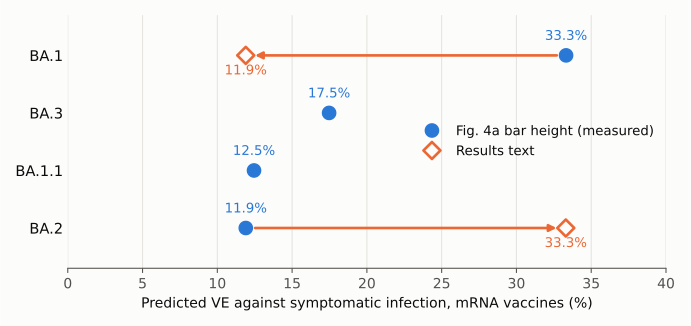
Figure 2. Predicted mRNA VE for each Omicron sublineage, as measured from the bar heights in Fig. 4a (blue dots), and the values the Results sentence gives for BA.1 and BA.2 (orange diamonds). The arrows run from the figure's value to the text's value for the same lineage. The text's 11.9% sits exactly on the figure's BA.2 value, and its 33.3% on the figure's BA.1 value. Axis from 0; the lineages are in the order of Fig. 4a.
Why it matters
The BA.1 versus BA.2 contrast is the paper's forward-looking claim about which Omicron sublineage existing mRNA vaccines would protect against least. It is one of only two variant-specific predictions in the Abstract. In the Results, the swapped sentence directly precedes the argument that differences between sublineages "might contribute to the considerable variations in VEs for Omicron reported from observational studies". It is also the only place in the text that attaches a number to a named sublineage. A reader who takes the numbers from the Results, for example to compare predicted protection as BA.2 replaced BA.1 in early 2022, gets the direction reversed: 33.3% against BA.2 and 11.9% against BA.1 instead of the reverse, a 2.8-fold ratio pointing the wrong way.
The paper's main findings are unaffected. These include the VE–genetic-distance relationship (R² 86.3% and 87.9%), the validation concordance (CCC 0.95), the Delta prediction (82.8%) and the 11.9–33.3% range. The Abstract and Fig. 4a are correct as published.
Explanations considered
- Different platform, model or time point. Does not apply. Both passages say mRNA vaccines, refer to the same four sublineages and describe the Fig. 4a prediction from the model fitted to all data.
- "Between X for A and Y for B" read as a bare range, with no pairing. Does not apply. The Results sentence explicitly writes "11.9% for BA.1 and 33.3% for BA.2". The Abstract explicitly names BA.1 as highest and BA.2 as lowest. The two cannot both hold.
- The Abstract is the passage in error. Ruled out by Fig. 4a. The mRNA bar for BA.1 measures 33.3% and the bar for BA.2 measures 11.9%. The x-axis order of the sublineages (BA.1, BA.3, BA.1.1, BA.2) also runs from highest to lowest mRNA VE.
- Bars mislabelled in the figure rather than the text. Not supported. The figure and the Abstract agree independently of each other, and the figure gives values for all four sublineages with BA.1 clearly separated from the other three (33.3% vs 17.5% or less). Only the single Results sentence departs from both.
- Rounding or measurement error. Does not apply. The measured values match the reported numbers to within 0.02 pp, and the disagreement is 21.4 pp.
- PMC conversion artefact. Ruled out. The publisher's HTML version of record has the same wording in both places.
Status
As of 2026-10-24:
- Version of record. The publisher's HTML (nature.com/articles/s41591-022-01877-1, fetched directly) has both passages word for word as quoted above. So do the PMC text and the Europe PMC full-text XML. Fig. 4a was measured from the publisher's full-resolution image.
- Supplements. Supplementary Information 1 (VE data tables, mutation tables, representative strains) and the reporting summary list no predicted VE values by sublineage. The code and data repository named in the paper (github.com/VaccineEffectivenessPrediction/COVID19-Vaccine-Effectiveness) returned 404. There is no separate Source Data file.
- Corrections. I found no correction, erratum or retraction. Crossref has no update relations, apart from a link to the medRxiv preprint 10.1101/2021.04.22.21254079. PMC and Europe PMC have no linked notices. The article page has no correction notice, and Retraction Watch has no entry for the DOI.
- PubPeer. It could not be queried directly (it requires human verification). A web search found no PubPeer thread for the article.
Sources: PMC9388371 (archived text); doi:10.1038/s41591-022-01877-1 (publisher HTML, Fig. 4 full-resolution PNG, Supplementary Information); Crossref and PMC/Europe PMC notice queries.
Suggested correction
In the Results, section "Prediction for variants and Omicron sublineages without known VEs", change "the expected VEs vary between 11.9% for BA.1 and 33.3% for BA.2, using the mRNA vaccines" to "the expected VEs vary between 33.3% for BA.1 and 11.9% for BA.2, using the mRNA vaccines". Alternatively, change it to "between 11.9% for BA.2 and 33.3% for BA.1". The Abstract and Fig. 4a need no change.