← Back to the plain-language case
Abstract and Results print the 180-day taste-recovery estimate above its own 95% confidence interval
BMJ (2022) · doi:10.1136/bmj-2021-069503 · PMC9326326
Summary
The abstract and the Results give taste recovery at 180 days as "98.0% (92.2% to 95.5%)". The upper bound is 2.5 percentage points below the point estimate (2.40 points even at the rounding limits), so the interval cannot be a confidence interval for that estimate. The paper's other 11 recovery intervals (smell and taste at 30 to 180 days, main text and supplementary Table S8) are all symmetric on the log(1 − recovery) scale. Applied to 98.0% and 92.2%, that pattern gives an upper bound of 99.49%, and supplementary Table S8 prints this row as "98.0 (92.2 to 99.5)", so the main-text "95.5" looks like a one-digit slip for 99.5. The point estimate and every conclusion are unaffected, but the interval as printed in the abstract is impossible, and the August 2022 correction did not change it.
What the paper reports
The PMC text flattens superscripts (I2, τ2 stand for I², τ²); wording is otherwise verbatim.
Abstract, Results:
At 30, 60, 90, and 180 days, respectively, 74.1% (95% confidence interval 64.0% to 81.3%), 85.8% (77.6% to 90.9%), 90.0% (83.3% to 94.0%), and 95.7% (89.5% to 98.3%) of patients recovered their sense of smell (I2=0.0-77.2%, τ2=0.006-0.050) and 78.8% (70.5% to 84.7%), 87.7% (82.0% to 91.6%), 90.3% (83.5% to 94.3%), and 98.0% (92.2% to 95.5%) recovered their sense of taste (range of I2=0.0-72.1%, τ2=0.000-0.015).
Results, "Reconstructed IPD meta-analyses and cure models > Recovery of taste":
Recovery of taste (fig 2) occurred in 78.8% (95% confidence interval 70.5% to 84.7%) of patients at 30 days, 87.7% (82.0% to 91.6%) at 60 days, 90.3% (83.5% to 94.3%) at 90 days, and 98.0% (92.2% to 95.5%) at 180 days (I2=16%, τ2=0.000-0.015), with median recovery time of 12.4 days (95% confidence interval 10.3 to 16.3 days).
Results, "Recovery of smell" (for comparison, same method):
From the random effects distribution-free summary survival curves, 74.1% (95% confidence interval 64.0% to 81.3%) of participants recovered their sense of smell at 30 days, 85.8% (77.6% to 90.9%) at 60 days, 90.0% (83.3% to 94.0%) at 90 days, and 95.7% (89.5% to 98.3%) at 180 days
Methods, statistical analysis:
In the primary analysis, we used a non-parametric two stage random effects model to retrieve a distribution-free summary survival curve.
Figure 2 legend (how the confidence band of the summary curve was obtained):
translucent blue band represents 95% confidence intervals (CIs) obtained by extension of Greenwood’s formula with the delta method
Discussion, first paragraph, and the "What this study adds" box repeat the estimate as 98%:
In this meta-analysis of time-to-event data from 3699 patients in 18 studies, an estimated 74%, 86%, 90%, and 96% of patients self-reported smell recovery and 79%, 88%, 90%, and 98% self-reported taste recovery at 30, 60, 90, and 180 days, respectively.
Meta-analyses of reconstructed time-to-event individual patient data (IPD) showed that at 30, 60, 90, and 180 days, respectively, about 74%, 86%, 90%, and 96% of patients self-reported smell recovery and 79%, 88%, 90%, and 98% of patients self-reported taste recovery, among patients who remained alive at the given time
Supplementary Table S8 (GRADE evaluation of pooled IPD outcomes, supplement p. 43), taste recovery rows, as extracted from the PDF:
Day 30 78.8 (70.5 to 84.7) · Day 60 82.0 (82.0 to 91.6) · Day 90 90.3 (83.5 to 94.3) · Day 120 92.2 (85.9 to 95.7) · Day 150 97.1 (92.8 to 98.8) · Day 180 98.0 (92.2 to 99.5)
What the paper's own numbers show
Method. First, I checked whether each printed interval contains its estimate, including at the limits of one-decimal rounding. Second, I worked out on which scale the paper's intervals are symmetric. The summary curve is a survival curve S(t) = 1 − recovery, and its band comes from Greenwood's formula with the delta method, so a log-transformed interval for S is the natural candidate. For each interval I computed the half-widths a = log(Supper/S) and b = log(S/Slower), where the recovery interval (L, U) maps to S in (1 − U, 1 − L), and took their ratio b/a, which is 1 for an exactly symmetric interval. I used the 8 main-text intervals and the 4 extra time points (120 and 150 days) that only Table S8 gives. Third, I used that symmetry to recover the upper bound implied by the printed estimate and lower bound. Every number below is printed by recompute.py.txt.
| Quantity | Location | Reported | Recomputed from the paper's own numbers |
|---|---|---|---|
| Does the taste 180-day CI contain its estimate? | Abstract; Results, "Recovery of taste" | 98.0% (92.2% to 95.5%) | No. The estimate exceeds the upper bound by 2.5 points; by at least 2.40 points at the rounding limits (97.95 vs 95.55) |
| Do the other 11 CIs contain their estimates? | Abstract; Results; Table S8 | smell and taste at 30, 60, 90, 120, 150, 180 days | Yes, all of them |
| b/a ratio, log(1 − recovery) scale, the other 11 intervals | derived | — | 0.97 to 1.04 (smell 0.99, 0.98, 1.00, 1.00, 1.03, 1.04; taste 0.99, 1.00, 1.00, 1.01, 0.97) |
| b/a ratio, taste 180 days, as printed | derived | — | −0.60 (b is negative: the "upper" bound is on the wrong side of the estimate) |
| Upper bound implied by 98.0 and 92.2, log(1 − recovery) symmetry | derived | 95.5% | 99.49% (S = 0.020, Supper = 0.078, Slower = 0.020²/0.078 = 0.00513); 99.46% to 99.52% over the rounding ranges of the inputs |
| Same, logit symmetry | derived | 95.5% | 99.51% |
| Taste 180-day upper bound in the supplement | Table S8, p. 43 | 99.5 | b/a = 1.02 with 99.5, in line with the other 11 intervals |
| Estimate at which 92.2–95.5 would be centred | derived | 98.0% | 94.08% (log(1 − recovery) midpoint); 94.06% (logit midpoint). This conflicts with 98.0 in the abstract, Results and Table S8 and with 98% in the Discussion and "What this study adds" |
The printed 95.5 and the value the other intervals imply, 99.5, differ in a single digit. The supplement prints 99.5 in the same position. The estimate 98.0 and the lower bound 92.2 appear identically in the main text and the supplement, and together with 99.5 they form an interval with the same shape as the paper's other intervals.
Figure
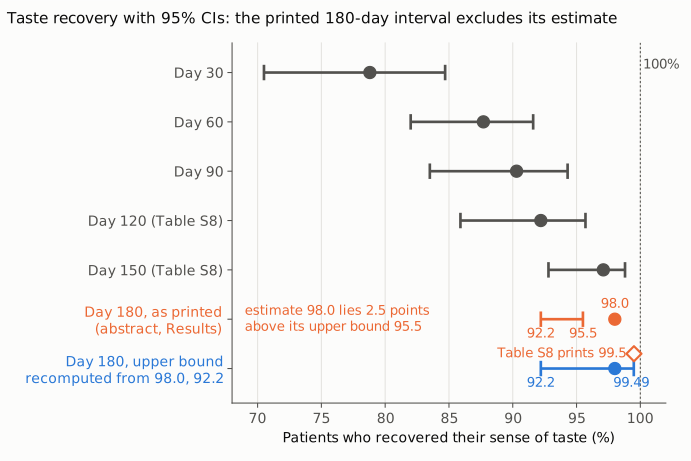
Figure 1. Taste recovery (%) with 95% CIs, on one linear axis from 68% to 102%; the dotted line marks 100%. Grey rows are the paper's intervals at 30, 60 and 90 days (abstract and Results) and at 120 and 150 days (Table S8 only), shown for context. The orange row is the 180-day interval printed in the abstract and Results, 98.0% (92.2% to 95.5%): the estimate (dot) lies to the right of the whole interval. The blue row keeps the printed estimate and lower bound and replaces the upper bound with the value implied by log(1 − recovery) symmetry, 99.49% (recompute.py.txt, section 3). The open orange diamond is the upper bound printed in supplementary Table S8, 99.5%.
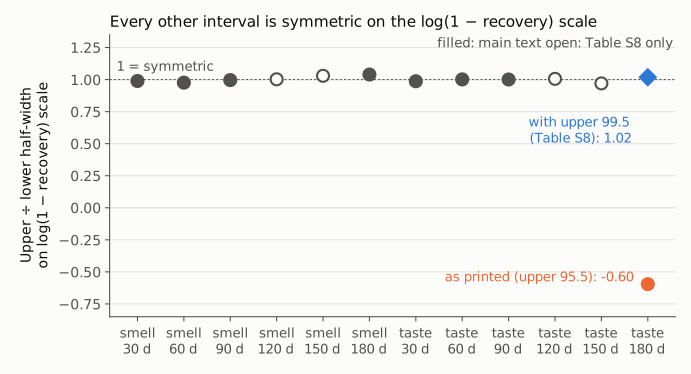
Figure 2. For each of the paper's 12 recovery intervals (smell and taste at 30 to 180 days), the ratio b/a of the upper to the lower half-width on the log(1 − recovery) scale; 1 (dotted line) means exactly symmetric. Filled circles are intervals given in the main text, open circles those given only in Table S8. All 11 intervals other than taste at 180 days lie between 0.97 and 1.04. The printed taste 180-day interval gives −0.60 (orange), which no transformation can produce. Replacing its upper bound by the Table S8 value 99.5 gives 1.02 (blue diamond). This figure shows why the recomputed bound in Figure 1 is grounded in the paper's own method rather than assumed.
Why it matters
- The interval is impossible as printed, and it is in the abstract. A reader who takes the 180-day taste result from the abstract or the Results gets a confidence interval that excludes its own estimate. Any secondary use of the interval (for example, recomputing a standard error for a later meta-analysis or a GRADE imprecision judgement) would be wrong. Taken at face value, 92.2–95.5 would imply an estimate of about 94.1%, not 98.0%.
- The correct precision is much wider on the upper side than printed. With 99.5 as the upper bound, the interval runs from 92.2% to 99.5%. Table S8 notes that the 180-day taste estimate rests on a single study ("τ2 = N.A. (single study)"), which fits this wide interval.
- The estimate and the conclusions are not affected. The 98.0% estimate is the same in the abstract, the Results, the Discussion, "What this study adds" and Table S8. The paper's primary outcomes, as it states ("The primary outcomes were the proportions of patients remaining with smell or taste dysfunction."), are reported from the cure models as 5.6% (2.7% to 11.0%) for smell and 4.4% (1.2% to 14.6%) for taste. Those estimates, the worldwide projections of about 15 million and 12 million people, and the prognostic-factor odds ratios do not depend on this interval. Only the stated precision of one descriptive time point is wrong.
Explanations considered
- A different quantity, model or population for the interval. Not supported. In both places the interval directly follows the 98.0% estimate in a list of four estimate-and-CI pairs that share one sentence and one method (the random-effects distribution-free summary survival curve). No footnote or legend redefines it, and the other three pairs in each list are internally consistent.
- An asymmetric or back-transformed interval. Cannot explain it. The paper's intervals are asymmetric on the percentage scale but almost exactly symmetric on the log(1 − recovery) scale (b/a 0.97 to 1.04), as expected for a log-transformed Greenwood/delta-method interval. A monotone back-transformation keeps an estimate inside its interval, so no such transformation can put 98.0 above an upper bound of 95.5 (b/a = −0.60).
- Rounding. Cannot explain it. The smallest estimate that rounds to 98.0 (97.95) exceeds the largest upper bound that rounds to 95.5 (95.55) by 2.40 points.
- The point estimate, not the bound, is wrong. Not supported. 98.0 appears in the abstract, the Results and Table S8, and 98% appears in the Discussion and "What this study adds". An interval of 92.2–95.5 would centre on about 94.1%, a value the paper gives nowhere.
- The lower bound is wrong. Not supported. 92.2 appears identically in the main text and Table S8, and with 98.0 it implies an upper bound (99.49%) that matches the Table S8 value of 99.5.
- A text-conversion or typesetting artifact. Ruled out. The publisher's pages returned HTTP 403 to automated requests, so I could not read the typeset BMJ page. In the archived version of record, the figure is plain inline text (not a table cell) in two separate places, the abstract and the Results, and it reads "98.0% (92.2% to 95.5%)" in the PMC HTML page, the Europe PMC full-text XML and the PMC text read with
src/show.py. No minus signs, superscripts or special characters are involved. - A correction already issued. No. The one correction (see Status) does not concern this interval.
- Related reporting slips, not part of the main finding. (1) Table S8 gives taste recovery at 60 days as "82.0 (82.0 to 91.6)", with the estimate equal to its lower bound; the main text gives 87.7, which with 82.0–91.6 is log-symmetric (b/a = 1.00). (2) The 95% prediction interval for persistent taste dysfunction is "0.0% to 49.0%" in the abstract but "0.2% to 49.0%" in the Results; Table S8 gives "PI: 0.002 to 0.490". (3) The I² for the taste cure fraction is "I2=67%" in the abstract and Table S8 but "I2=0.0-72.1%" in the Results, the same range the abstract attaches to the taste recovery curves. None of these changes any conclusion.
Status
- Version of record. The BMJ article page, full-text PDF and rapid-responses page (reached through doi.org) returned HTTP 403 to automated requests. The archived version of record was checked in two independent renderings: the PMC article page (https://pmc.ncbi.nlm.nih.gov/articles/PMC9326326/) and the Europe PMC full-text XML. Both carry "98.0% (92.2% to 95.5%)" in the abstract and in the Results. Every quotation from the main text above was checked verbatim against the PMC-archived text with
src/show.py. - Supplements. The single supplementary file,
tanb069503.ww.pdf(61 pages), was obtained from the Europe PMC supplementary-files bundle for PMC9326326. Its Table S8 (p. 43) prints the 180-day taste row as "98.0 (92.2 to 99.5)" from "1498 (10 studies)", and its smell rows match the main text. The supplement resolves the error: the main-text upper bound should read 99.5%. - Corrections and notices. One correction exists: BMJ 2022;378:o1939, doi:10.1136/bmj.o1939 (PMC9361052), dated 9 August 2022, found through the Crossref updated-by relation,
src/known.pyand Europe PMC. Its text, read in full via Europe PMC, only inserts the phrase "with initial dysfunction" into the abstract's sentence on cure-model estimates, the fourth point of "What this study adds" and the second paragraph of the Discussion. It does not mention the 180-day taste interval. PMC metadata also links an expression of concern (PMC9691145); its Europe PMC record is titled "Expression of concern: 6-month consequences of COVID-19 in patients discharged from hospital: a cohort study" (Lancet, doi:10.1016/s0140-6736(22)02370-4), so it concerns a primary study, not this paper. No retraction was found. - PubPeer and comments. The PubPeer API required human verification and returned no data to an automated DOI query, so PubPeer could not be checked directly. A web search for the title with "PubPeer" found no thread, and a web search for the exact string "98.0% (92.2% to 95.5%)" found no discussion of the interval. The BMJ rapid responses could not be read (HTTP 403).
- Sources (as of 2026-10-24). PMC article PMC9326326; Europe PMC full-text XML and supplementary files for PMC9326326; supplement
tanb069503.ww.pdf; correction PMC9361052 (doi:10.1136/bmj.o1939); Europe PMC record PMC9691145; Crossref; PubPeer; https://doi.org/10.1136/bmj-2021-069503.
Suggested correction
In the Results section of the abstract and in the Results paragraph "Recovery of taste", replace
98.0% (92.2% to 95.5%)
with
98.0% (92.2% to 99.5%)
matching supplementary Table S8, after the authors confirm the value from their model output. They may also wish to correct, in Table S8, the 60-day taste estimate from 82.0 to 87.7, and to reconcile the lower limit of the 95% prediction interval for persistent taste dysfunction (0.0% in the abstract, 0.2% in the Results and Table S8) and the I² reported for the taste cure fraction (67% in the abstract and Table S8, 0.0-72.1% in the Results).