← Back to the plain-language case
Hazard ratio for symptomatic COVID-19 (0.011) lies outside its own 95% confidence interval (0.063–0.198)
Kidney Int (2022) · doi:10.1016/j.kint.2022.07.008 · PMC9297679
Summary
This research letter compares 333 kidney transplant recipients (KTRs) who received tixagevimab–cilgavimab preexposure prophylaxis with 97 who did not. For its first outcome, symptomatic COVID-19, it reports a hazard ratio of 0.011 with a 95% CI of 0.063–0.198. A point estimate cannot lie below its own confidence interval. The geometric centre of the interval is 0.112, about ten times the printed value. The paper's other three HRs each sit at the centre of their intervals (ratios 0.997 to 1.027), which points to a dropped digit, with 0.011 printed for about 0.11. Direction and significance do not change. The printed value does overstate the effect size for the key outcome: it implies about a 99% lower hazard, while the interval implies 80–94%, about 89% at its centre.
What the paper reports
Main text, third paragraph (the letter has no abstract and no separate Results heading):
Among the 333 KTRs who received tixagevimab–cilgavimab, 12.3% developed symptomatic COVID-19 compared with 43.3% among those who did not (hazard ratio [HR], 0.011; 95% confidence interval [CI], 0.063–0.198; P < 0.001; Figure 1a).
The same paragraph, for the other three outcomes:
(HR, 0.046; 95% CI, 0.013–0.158; P < 0.001; Figure 1b)
(HR, 0.045; 95% CI, 0.008–0.240; P < 0.001; Figure 1c)
(HR, 0.076; 95% CI, 0.005–1.161; P = 0.066; Figure 1d)
Table 1, row "Symptomatic COVID-19" (columns: treated, n = 333 | untreated, n = 97; n (%)):
Symptomatic COVID-19 | 41 (12.3) | 42 (43.3)
Figure 1 legend:
Log-rank test was used to compare the 2 groups and was considered as significant when P < 0.05.
Main text, fourth paragraph:
The first conclusion of this real-life study is that tixagevimab–cilgavimab use was associated with (i) a significantly lower risk of symptomatic COVID-19 and (ii) fewer COVID-19–related hospitalizations (including intensive care unit), compared with patients who did not receive this prophylactic treatment.
What the paper's own numbers show
Method. A 95% CI for a hazard ratio, whether Wald-type from a Cox model or from a log-rank-based estimate, is built on the log scale: log HR ± 1.96 × SE. The estimate therefore lies inside the interval, at its geometric centre √(lower × upper). I computed that centre for each of the four reported intervals and compared it with the printed HR. I also took the SE of log HR implied by each interval's width, used it to recompute a two-sided P value, and checked the event percentages against the counts in Table 1. The paper does not say how the HRs were estimated: the Figure 1 legend names only the log-rank test. Every number below is printed by recompute.py.txt.
| Quantity | Location | Reported | Recomputed from the paper's own numbers |
|---|---|---|---|
| HR, symptomatic COVID-19 | Text, para. 3 | 0.011 (95% CI 0.063–0.198) | outside its CI; CI centre = 0.1117 |
| Printed HR ÷ CI centre, symptomatic | — | — | 0.098 (the centre is 10.2 × the printed HR) |
| Rounding check, symptomatic | — | 0.011 vs lower bound 0.063 | largest value shown as 0.011 is 0.0115; smallest shown as 0.063 is 0.0625 (5.4× apart) |
| Distance of 0.011 below the lower bound | — | — | 1.75 log units; the CI half-width is 0.57 log units |
| 95% CI that HR 0.011 would have with the same SE | — | — | 0.0062–0.0195 |
| HR, hospitalization | Text, para. 3 | 0.046 (0.013–0.158) | inside; centre 0.0453; ratio 1.015 |
| HR, ICU hospitalization | Text, para. 3 | 0.045 (0.008–0.240) | inside; centre 0.0438; ratio 1.027 |
| HR, death | Text, para. 3 | 0.076 (0.005–1.161) | inside; centre 0.0762; ratio 0.997 |
| P, symptomatic | Text, para. 3 | < 0.001 | 6.2 × 10⁻¹⁴ from the CI (z = −7.50); < 0.001 either way |
| P, hospitalization / ICU | Text, para. 3 | < 0.001 / < 0.001 | 1.2 × 10⁻⁶ / 0.00031 |
| P, death | Text, para. 3; Figure 1d panel | 0.066 (text); "Log-rank: P = 0.064" (figure) | 0.064 |
| Symptomatic COVID-19, treated / untreated | Table 1; text | 41 (12.3%) / 42 (43.3%) | 41/333 = 12.31%; 42/97 = 43.30% |
| Hospitalization | Table 1; text | 4 (1.2) / 11 (11.3) | 1.20% / 11.34% |
| ICU hospitalization | Table 1; text | 2 (0.6) / 6 (6.2) | 0.60% / 6.19% |
| Death | Table 1; text | 1 (0.3) / 2 (2) | 0.30% / 2.06% |
| Crude risk ratio, symptomatic | from Table 1 | — | 0.284 |
| HR ÷ crude risk ratio | from text and Table 1 | — | hospitalization 0.43, ICU 0.46, death 0.52; symptomatic 0.39 at the CI centre, 0.039 for the printed HR |
| Hazard reduction, symptomatic | — | 99% implied by HR 0.011 | 89% at the CI centre; 80% to 94% across the CI |
The counts and percentages are all correct, and the hospitalization, ICU and death HRs agree with their intervals to within the three-decimal rounding of the printed bounds. Only the symptomatic HR disagrees with its interval. Its interval width (SE of log HR 0.292) is the narrowest of the four, as expected for the outcome with the most events (83). A scale check that does not rely on the CI points the same way. For the three consistent outcomes, the HR is 0.43 to 0.52 times the crude risk ratio. At 0.112 the symptomatic HR would be 0.39 times its crude risk ratio, in line with the others. At 0.011 it would be 0.039 times.
Figure
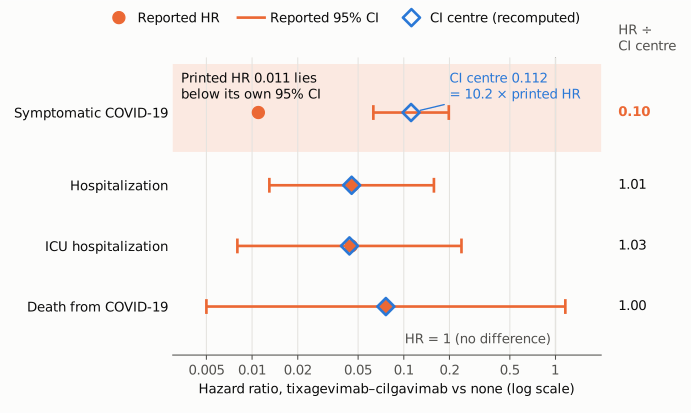
Figure 1. The four hazard ratios reported in the letter, on one log-scaled axis. Orange dots are the HRs printed in the text and orange bars are the 95% CIs printed with them. Open blue diamonds mark the geometric centre of each printed CI, recomputed by recompute.py.txt. That centre is where a log-scale interval places its own estimate. The right-hand column gives the printed HR divided by that centre. For hospitalization, ICU hospitalization and death, the dot and diamond coincide (ratio 1.00 to 1.03). For symptomatic COVID-19 (shaded row), the printed 0.011 lies outside its interval and is 0.10 times the centre of 0.112. The thin vertical line marks HR = 1 (no difference). All values come from the paper's text or from recompute.py.txt.
Why it matters
- It is the key result. Symptomatic COVID-19 is the first outcome reported and the basis of the letter's first conclusion ("a significantly lower risk of symptomatic COVID-19"). The paragraph quoted above is the only place where the effect size is given. The paper has no abstract or results table that states it differently.
- The effect size is overstated about tenfold. HR 0.011 implies about a 99% lower hazard, close to complete protection. The reported interval implies 80–94% (about 89% at its centre). The printed figure also makes symptomatic infection look like the outcome most strongly prevented, ahead of hospitalization and ICU admission (HR about 0.045). The interval says the reverse: symptomatic infection was the least reduced of the morbidity outcomes. That fits the letter's own remark that the dose "offers an incomplete protection", with 12.3% of treated patients still developing symptomatic disease.
- Direction and significance do not change. The whole interval lies below 1, and the P value implied by the interval is far below 0.001. The qualitative conclusions hold, and so do the hospitalization, ICU and death results.
- Readers who extract effect sizes. Meta-analysts and guideline authors who take the point estimate from the text will get a value about ten times too extreme. Those who rebuild the log HR and SE from the CI will get the intended value, so the two routes give different answers. Any corrected estimate still comes from a retrospective, non-randomized comparison with an untreated group that differed at baseline: for example, cardiovascular events in the last 3 months were 0% in the treated group and 10.3% in the untreated group (Table 1).
Explanations considered
- Rounding. Cannot explain it. Any value that displays as 0.011 is at most 0.0115. Any lower bound that displays as 0.063 is at least 0.0625.
- An asymmetric or profile-likelihood interval. Cannot explain it. Such intervals can be off-centre, but they still contain their estimate. Here 0.011 lies 1.75 log units below the lower bound, three times the interval's half-width.
- The CI belongs to a different estimate (for example an adjusted model) or a different outcome. Not supported. The letter describes only one analysis per outcome and no adjusted model. Even an adjusted HR would have to lie inside its own interval. Figure 1a shows only Kaplan–Meier curves and "Log-rank: P < 0.001", with no HR or CI to compare against.
- A reporting convention specific to this paper. Ruled out by the paper's own numbers. The other three HR–CI pairs in the same paragraph sit at the geometric centres of their intervals (ratios 0.997 to 1.027). The death P recomputed from its interval (0.064) matches the log-rank P printed in Figure 1d. So these are ordinary log-scale intervals, and the symptomatic interval centres on 0.112.
- Conversion or typesetting in the archive. Not likely. The same sentence appears in the PMC rendering, in the Europe PMC full-text XML and in the local archived copy. All derive from the publisher's deposit of the final article (Kidney Int 102(4):936–938). The error is a digit, not a symbol or superscript that conversion might lose.
- Which number is wrong. The paper's own numbers favour the point estimate as the misprint. An HR of about 0.11 fits the interval, the pattern of the other three outcomes and the HR-to-crude-risk-ratio scale check. The exact intended value (0.110, 0.111 or 0.112) cannot be recovered from the published data. A misprinted interval cannot be excluded either, but it would require both bounds to be wrong while still fitting the scale check.
- Side inconsistencies (minor, not part of the main finding). (1) For death, the text gives P = 0.066 and the Figure 1d panel gives "Log-rank: P = 0.064". The value recomputed from the HR and CI is 0.064. The two figures may come from different tests, and the difference changes nothing. (2) The reasons for non-treatment are given as percentages of all 430 KTRs. Two are rounded (2.33% → 2.3, 11.86% → 11.9) and two are rounded down (4.88% → 4.8 for refusal, 3.49% → 3.4 for other reasons). The counts sum to 97, as stated.
Status
- Version of record. The quoted sentence, with HR 0.011 and CI 0.063–0.198, is identical in the PMC article page, the Europe PMC full-text XML and the archived text read with
src/show.py. That PMC copy is the publisher's deposit of the final article: Kidney Int 102(4):936–938, PMID 35870641. Search-engine snippets of the article show the same numbers. The publisher's own pages could not be opened by automated requests: doi.org led to a linkinghub.elsevier.com redirect stub, kidney-international.org and ScienceDirect returned HTTP 403, and the PMC PDF returned 403. Every quotation above was checked verbatim against the PMC-archived text withsrc/show.py --grep. The "Log-rank: P = 0.064" text was read from the Figure 1 image (gr1_lrg.jpg) archived in PMC. - Supplements. None. The PMC page and Europe PMC XML list no supplementary material, and the data statement reads "All relevant data are within the article." Figure 1 gives no HR or CI, so it cannot tell whether the HR or the interval is the misprint.
- Corrections and comments. As of 2026-10-24 I found no correction, erratum, retraction or expression of concern.
src/known.pyreturns no Crossref update relations, no PMC notices and no Europe PMC notices. The Crossref filterupdates:10.1016/j.kint.2022.07.008finds no items. The Europe PMC record lists only a "Comment on" link to PMID 35618094, the earlier study the letter responds to, and no erratum. PubPeer's API refused automated requests (human verification required, HTTP 403). A web search for the title together with "PubPeer" found no thread for this article. - Sources. PMC article PMC9297679 and its Figure 1 image; Europe PMC full-text XML and record for PMC9297679; Crossref; PubMed/Europe PMC (PMID 35870641); PubPeer; https://doi.org/10.1016/j.kint.2022.07.008.
Suggested correction
In the third paragraph, the HR for symptomatic COVID-19 should be checked against the original analysis output and the sentence corrected to read
(hazard ratio [HR], 0.11x; 95% confidence interval [CI], 0.063–0.198; P < 0.001; Figure 1a)
where 0.11x is the estimate from the model that produced the interval. The interval implies a value close to 0.112. If the interval is the misprinted part instead, both bounds should be corrected. The authors may also wish to state the method used to estimate the HRs, since the Figure 1 legend names only the log-rank test. They could also make the P value for death the same in the text (0.066) and in Figure 1d (0.064).