← Back to the plain-language case
Abstract and Results text attach the 30-day follow-up estimate or CI to 7-day follow-up
JAMA Netw Open (2022) · doi:10.1001/jamanetworkopen.2022.18730 · PMC9237790
Summary
The abstract reports that patients in high-telemental-health-use counties were 13.7 percentage points (95% CI, 5.1-22.3) (6.5% relative increase) more likely to have outpatient follow-up within 7 days of a mental health hospitalization. The Results text gives the same outcome as 2.2 percentage points with the same interval, 5.1-22.3. In the paper's Table 2, the 7-day estimate is 2.2 (−1.0 to 5.5), a 6.5% relative change. The 30-day estimate is 13.7 (5.1 to 22.3), a 20.4% relative change. So the abstract pairs the 30-day estimate and interval with the 7-day relative change, and the Results text pairs the 7-day estimate with the 30-day interval, which does not contain it. According to Table 2, the 7-day association is not statistically significant (approximate z ≈ 1.33, p ≈ 0.18), while the abstract presents it as a large, significant effect.
What the paper reports
Abstract, Results:
Compared with no telemental health care in the county, patients in high-use counties were 1.2 percentage points (95% CI, 0.81-1.60 percentage points) (8.0% relative increase) more likely to have a minimum number of specialty mental health service visits, 13.7 percentage points (95% CI, 5.1-22.3 percentage points) (6.5% relative increase) more likely to have outpatient follow-up within 7 days of a mental health hospitalization, and 0.47 percentage points (95% CI, 0.25-0.69 percentage points) (7.6% relative increase) more likely to be hospitalized in a year.
Results, section "Changes in Likelihood of Receiving Other Forms of Utilization":
In our main model, compared with patients in the no telemental health service use counties, patients in high telemental health service use counties were 1.2 percentage points (95% CI, 0.81-1.60 percentage points) (8.0% relative increase) more likely to have a minimum of 4 specialty mental health service visits, 2.2 percentage points (95% CI, 5.1-22.3 percentage points) (6.5% relative increase) more likely to have outpatient follow-up within 7 days of a mental health hospitalization, and 0.47 percentage points (95% CI, 0.25-0.69 percentage points) (7.6% relative increase) more likely to be hospitalized in a year (Table 2).
Table 2, "Association Between Telemental Health Use in Nonmetropolitan Counties and Outcomes for Patients With Serious Mental Illness", excerpt. Columns: reference rate in 2010 in no use, %; then for low, moderate and high use, % difference compared with reference group (95% CI) and % change relative to no use group:
Follow-up after hospitalization, %
7 d | 34.0 | -0.3 (-2.0 to 1.5) | -0.8 | 1.1 (-1.5 to 3.7) | 3.2 | 2.2 (-1.0 to 5.5) | 6.5
30 d | 67.0 | 3.4 (-1.3 to 8.1) | 5.1 | 11.0 (4.1 to 17.9) | 16.4 | 13.7 (5.1 to 22.3) | 20.4
Methods, section "Quality Measures":
Consistent with a National Committee for Quality Assurance measure, we captured what fraction of patients with mental health hospitalizations had an outpatient mental health service visit within 7 or 30 days of discharge.
Methods, section "Statistical Analysis":
Statistical analysis was done with 2-sided hypothesis tests, with α = .05 as the significance threshold.
Conclusions:
In this cohort study, at a county level, among nonmetropolitan beneficiaries with SMI, we found that greater use of telemental health service was associated with modest increases in contact with outpatient specialty mental health professionals and a greater likelihood of follow-up after hospitalization.
What the paper's own numbers show
Method. I took the high-use column of Table 2 (difference, 95% CI and relative change against the 2010 no-use reference rate) for every outcome. For each row I checked that the relative change equals difference ÷ reference rate and that the difference sits at the midpoint of its interval. I then matched each number in the two text statements about 7-day follow-up to the Table 2 row it reproduces. To judge significance I took the standard error from the printed interval, SE = (upper − lower) ÷ (2 × 1.96), and formed an approximate Wald z = estimate ÷ SE. I repeated this over every combination of ±0.05 rounding in the three printed values. Every number below is printed by recompute.py.txt.
| Quantity | Location | Reported | Recomputed from the paper's own numbers |
|---|---|---|---|
| 7-day follow-up, high vs no use | Table 2 | 2.2 (−1.0 to 5.5); 6.5% | CI midpoint 2.25; 2.2 ÷ 34.0 = 6.47%. Consistent. CI includes 0 |
| 30-day follow-up, high vs no use | Table 2 | 13.7 (5.1 to 22.3); 20.4% | CI midpoint 13.70; 13.7 ÷ 67.0 = 20.45%. Consistent |
| 7-day follow-up as stated in the abstract | Abstract, Results | 13.7 (5.1-22.3); 6.5% relative | 13.7 and 5.1-22.3 are the 30-day row. 13.7 ÷ 34.0 = 40.3%, not 6.5%. 6.5% × 34.0 = 2.21 pp, the 7-day row |
| 7-day follow-up as stated in the Results text | Results, "Changes in Likelihood…" | 2.2 (5.1-22.3); 6.5% relative | 2.2 and 6.5% are the 7-day row. 5.1-22.3 is the 30-day interval (midpoint 13.70); 2.2 lies 2.9 pp below its lower bound |
| Abstract 7-day estimate ÷ Table 2 7-day estimate | Abstract vs Table 2 | 13.7 vs 2.2 | ratio 6.2 |
| Approximate test, 7-day | Table 2 interval | not reported | SE 1.66 pp; z = 1.33, p = 0.18 (over rounding: z 1.28 to 1.38, p 0.17 to 0.20) |
| Approximate test, 30-day | Table 2 interval | not reported | SE 4.39 pp; z = 3.12, p = 0.0018 (over rounding: p 0.0016 to 0.0020) |
| Visits estimate in the same two sentences | Abstract; Results vs Table 2 | 1.2 (0.81-1.60); 8.0% | Table 2: 1.2 (0.8 to 1.6); 8.0. Matches after rounding |
| Hospitalization estimate in the same two sentences | Abstract; Results vs Table 2 | 0.47 (0.25-0.69); 7.6% | Table 2: 0.5 (0.3 to 0.7); 7.6. Matches after rounding |
The other two estimates in each sentence agree with the Table 2 high-use column, so both sentences report the Table 2 main model. Within the follow-up statement, no single row of Table 2 gives all three numbers. In the abstract, the estimate and interval come from the 30-day row and the relative change from the 7-day row. In the Results text, the estimate and relative change come from the 7-day row and the interval from the 30-day row. Table 2 itself is internally consistent: each relative change equals difference ÷ reference rate, and each difference sits at the midpoint of its interval.
Figure
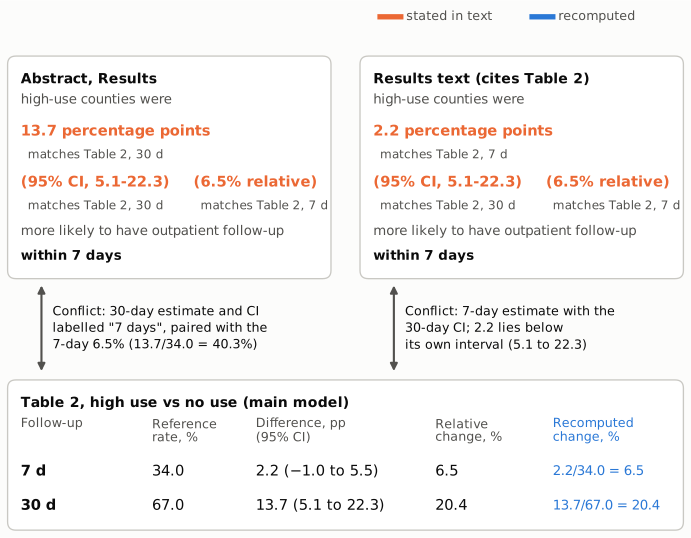
Figure 1. Shortened excerpts of the two text statements about 7-day follow-up (top) and the two follow-up rows of Table 2, high-use vs no-use column (bottom). Numbers stated in the text are in orange, and each carries a tag naming the Table 2 row it matches. The relative changes recomputed as difference ÷ reference rate are in blue. In the abstract, the estimate and CI match the 30-day row and the 6.5% matches the 7-day row; 13.7 ÷ 34.0 would be 40.3%. In the Results text, the estimate and 6.5% match the 7-day row and the CI matches the 30-day row, which puts the estimate outside its own interval.
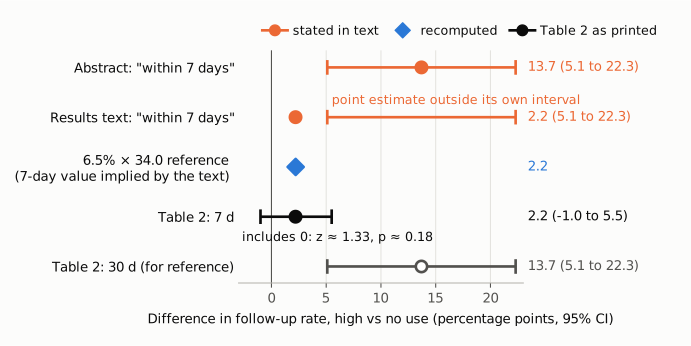
Figure 2. The 7-day follow-up estimates on one axis in percentage points, with 95% CIs; the thin vertical line is no difference (0). Orange: the two text statements, the abstract's 13.7 (5.1 to 22.3) and the Results text's 2.2 with the interval 5.1 to 22.3, which does not contain it. Blue diamond: the 7-day difference implied by the text's own 6.5% relative change and the 34.0% reference rate (2.21 pp). Black: Table 2's 7-day row, 2.2 (−1.0 to 5.5), which crosses 0 (approximate z ≈ 1.33, p ≈ 0.18). Open grey: Table 2's 30-day row, 13.7 (5.1 to 22.3), shown for reference. The abstract's 7-day interval is identical to the 30-day one.
Why it matters
- A quantified abstract result is misstated. The abstract reports one of its three numeric findings as a 13.7-point, statistically significant increase in 7-day post-hospitalization follow-up. The paper's own table gives 2.2 points, about one-sixth as large, with an interval (−1.0 to 5.5) that includes zero. At the paper's stated threshold (2-sided, α = .05), the 7-day association is not significant.
- The Results text gives the same wrong impression of significance. Its point estimate is correct, but the interval it gives (5.1-22.3) excludes zero, whereas the correct interval (−1.0 to 5.5) does not.
- The qualitative conclusion rests on narrower evidence than the abstract suggests. The Key Points and Conclusions say greater telemental health use was associated with "greater likelihood of follow-up after hospitalization", and the Discussion reports increases in patients receiving "follow-up care". That statement is still supported by the 30-day measure: 13.7 points (5.1 to 22.3), 20.4% relative, p ≈ 0.002. It is not supported by the 7-day measure. The Methods define both windows as parts of the same quality measure. A reader of the abstract alone would conclude that both were clearly improved.
- The 30-day result is not reported in the abstract or the Results text. The 13.7-point figure appears in the abstract under the 7-day label, so the 30-day result appears only in Table 2.
- The direction of the 7-day estimate is unchanged. It is positive in every version. The other estimates in both sentences, the remaining rows of Table 2, and the paper's other conclusions (visits, hospitalization, medication adherence) are not affected.
Explanations considered
- A different model, population or subgroup. Not supported. The Results sentence says "In our main model" and cites Table 2. Its other two estimates, and the abstract's, match the Table 2 high-use column after rounding: 1.2 (0.81-1.60), 8.0%, and 0.47 (0.25-0.69), 7.6%. Table 3, the subgroup and sensitivity table, has no follow-up rows. No table in the paper reports a 7-day estimate of 13.7 or a 7-day interval of 5.1 to 22.3.
- A different reference rate or denominator for the relative change. Not able to explain it. 6.5% equals only 2.2 ÷ 34.0, the 7-day row. 13.7 gives 20.4% against the 30-day reference (67.0) and 40.3% against the 7-day reference (34.0). No denominator in the table gives 13.7 together with 6.5%.
- A different interval type, such as a one-sided or non-symmetric interval. Ruled out for the Results text. An interval that does not contain its own point estimate (2.2 against 5.1 to 22.3) cannot be a confidence interval for that estimate of any kind. The Table 2 intervals are symmetric about their estimates to rounding (midpoints 2.25 and 13.70).
- The abstract meant 30-day follow-up. If so, the label "within 7 days" and the 6.5% relative increase are both wrong, since the 30-day relative change is 20.4%. If the abstract meant 7-day follow-up, then 13.7 and its interval are wrong. Either way, the three numbers in the abstract do not belong to one outcome.
- Table 2 is the version in error. Not supported. Each Table 2 row is internally consistent: each difference sits at the midpoint of its interval, and each relative change equals difference ÷ reference rate (6.47% and 20.45%). The text, by contrast, combines values from two rows, and in the Results text the estimate falls outside its interval.
- A text-conversion artifact. Ruled out. The publisher's full text, the PMC HTML page, the Europe PMC JATS XML and the PubMed abstract all carry the same numbers.
- A correction already issued. None found (see Status).
- Side observations, not part of the main finding. (1) The Results text says "a minimum of 4 specialty mental health service visits" and the abstract says "a minimum number", while the abstract's Main Outcomes says "a minimum of 2". The estimate (1.2, 8.0%) matches the Table 2 row "Per quarter in year" (at least 1 visit per quarter). (2) For hospitalization, 0.47 ÷ 6.0 = 7.83%. Even allowing for rounding of 0.47 and 6.0, the ratio is 7.69% to 7.98%, slightly above the reported 7.6%. The difference is small and does not affect any conclusion. (3) In the Subgroup Analyses text and Table 3, the dual-eligible medication estimate is given as "-0.01 months (95% CI, -0.02 to -0.09 months)", where the point estimate also lies outside the stated interval. That outcome is not part of this finding and was not examined further.
Status
- Version of record. I checked the publisher's full text (jamanetwork.com, article 2793628, reached through doi.org), the PMC HTML page and the Europe PMC full-text XML. All three carry the abstract sentence, the Results sentence and the Table 2 values quoted above. The PubMed record (PMID 35759264) carries the same abstract. Every quotation here was checked verbatim against the PMC-archived text with
src/show.py. The Table 2 excerpt is shown with the PMC text's hyphen-minus signs. - Supplements. The single supplement (eTable 1, antipsychotic and antimanic drugs; eTable 2, data dictionary for Table 1; eFigure, regression model; eTable 3, HCPCS codes) has no outcome estimates, so it cannot resolve the discrepancy. Its contents were judged from the caption in the article XML and the PMC page, because a direct download returned an HTML page rather than the PDF.
- Corrections and comments. As of 2026-10-24 I found no correction, erratum, retraction or expression of concern.
src/known.pyreturns no Crossref update relations, no PMC notices and no Europe PMC notices. The Crossref record has no update-to or updated-by entries. The PubMed record has no CommentsCorrections entries. Neither the publisher page nor the PMC page shows a correction notice. Web searches for a correction or erratum found only the article and news coverage, and a Retraction Watch search found nothing. The PubPeer API returned no record (HTTP 404) for the DOI; the PubPeer website itself could not be searched (HTTP 403 and a Cloudflare challenge). The Europe PMC search service was unavailable (HTTP 503) on every attempt. - Sources. PMC article PMC9237790; https://doi.org/10.1001/jamanetworkopen.2022.18730 (publisher full text); Europe PMC full-text XML for PMC9237790; PubMed 35759264 (E-utilities); Crossref; PubPeer; Retraction Watch; web search.
Suggested correction
In the abstract, Results, replace
13.7 percentage points (95% CI, 5.1-22.3 percentage points) (6.5% relative increase) more likely to have outpatient follow-up within 7 days of a mental health hospitalization
with
2.2 percentage points (95% CI, −1.0 to 5.5 percentage points) (6.5% relative increase; not statistically significant) more likely to have outpatient follow-up within 7 days, and 13.7 percentage points (95% CI, 5.1-22.3 percentage points) (20.4% relative increase) more likely to have outpatient follow-up within 30 days of a mental health hospitalization
In the Results section "Changes in Likelihood of Receiving Other Forms of Utilization", change "2.2 percentage points (95% CI, 5.1-22.3 percentage points)" to "2.2 percentage points (95% CI, −1.0 to 5.5 percentage points)". The authors may wish to add the 30-day estimate in the same way. They may also wish to qualify "greater likelihood of follow-up after hospitalization" in the Key Points and Conclusions to say that the association was significant for 30-day but not 7-day follow-up, and to reconcile "a minimum of 4" in the Results with the "≥1 visit per quarter" row it reports.