← Back to the plain-language case
Abstract reverses the omnivore-versus-plant-diet direction for Prevotella, Roseburia and Bacteroides given in the Results
Gut (2021) · doi:10.1136/gutjnl-2021-325168 · PMC9185830
Summary
The abstract states that omnivores had higher Prevotella and Roseburia and lower Bacteroides abundances than vegans and vegetarians. Every other place in the paper that gives these directions gives the opposite one. The Results and Discussion say that P. copri and Roseburia sp. CAG 182 were more abundant in vegetarians and vegans and that B. dorei prevailed in omnivores (Wilcoxon p<0.05, Figure 3A), and Figures 3A and 3C show the same thing: 0 of 13 direction statements outside the abstract agree with it. The abstract is the part of the paper most readers and indexing services see, and it reports the diet–microbiome contrast the wrong way round; the analysis and the paper's other headline results are not affected.
What the paper reports
All quotations were checked verbatim against the PMC-archived text with src/show.py (python recompute.py.txt --verify repeats the check), and against the publisher's typeset PDF (Gut 2022;71:1302–1314).
Abstract, Results paragraph:
In omnivores, higher Prevotella and Roseburia and lower Bacteroides abundances than in vegans and vegetarians were observed.
Abstract, Design paragraph (the population):
dietary recording from 120 healthy volunteers, equally distributed for the different diets and matched for sex and age
Results, section "Gut microbiome composition and functions and relation to faecal miRNAs", first paragraph:
Prevotella copri and Roseburia sp. CAG 182 showed higher abundance in VT/VN compared with O, while Bacteroides dorei (currently Phocaeicola dorei) prevailed in O (p<0.05; figure 3A).
Figure 3 legend, panels A and C:
(A) Box plots showing the relative abundance of three bacterial species differentially prevalent among the dietary groups. *Wilcoxon rank-sum p<0.05.
The colour indicates the dietary group in which the variable has the maximum level.
Discussion, paragraph on the gut microbiome:
the gut microbiome taxonomic composition varied according to the dietary patterns, with P. copri and Roseburia sp. CAG 182, having a higher abundance in VT/VN than O.
Discussion, paragraph on miR-425-3p:
Higher stool levels of miR-425-3p and miR-638 were also significantly correlated with Roseburia and R. bacterium D5, which in our cohort were significantly more abundant in VT/VN
Results, section "Integration of miRNAs, microbiome and diet" (the miRNA–taxon chain that depends on the direction):
Two DEmiRNAs, miR-425-3p and miR-638, attracted our interest since they were associated with a coherent higher expression in VT/VN compared with both the analysed O groups
Consistently, higher levels of Roseburia sp. CAG 182 and R. bacterium D5, as well as a lower abundance of A. colihominis were found in subjects within the highest expression levels of miR-638.
(O, omnivores; VT, vegetarians; VN, vegans.)
What the paper's own numbers show
Method. The paper prints no abundance values, effect sizes or exact p-values for these taxa, only the direction and "p<0.05", so there is nothing numeric to recompute. I instead coded every statement or display in the paper that says which diet group has more of a Prevotella, Roseburia or Bacteroides taxon as "higher in O" or "lower in O" and compared it with the abstract. The text statements come from the Results and Discussion. The figure entries were read from the archived Figure 3 image (Europe PMC, gutjnl-2021-325168f03.jpg). In panel A I used the box positions and the significance marks; in panel C I used the bar colour, which by the legend marks the group with the highest level (red O, green VN). recompute.py.txt holds the ledger and prints every count below.
| Quantity | Location | Reported (abstract) | What the rest of the paper shows |
|---|---|---|---|
| Prevotella direction | Results p1 (P. copri); Discussion; Fig. 3A | higher in O | lower in O: higher in VT/VN, O vs VT and O vs VN marked p<0.05 (0 of 3 agree) |
| Roseburia direction | Results p1 and Discussion (sp. CAG 182); Discussion (genus); Fig. 3A (sp. CAG 182); Fig. 3C (sp. CAG 182, R. hominis) | higher in O | lower in O: highest in VN, O vs VN marked p<0.05; both Fig. 3C bars coloured VN (0 of 6 agree) |
| Bacteroides direction | Results p1 (B. dorei); Fig. 3A (B. dorei); Fig. 3C (B. finegoldii, B. massiliensis) | lower in O | higher in O: B. dorei "prevailed in O", O vs VN marked p<0.05; both Fig. 3C bars coloured O (0 of 4 agree) |
| All direction statements | text (6) and figures (7) | — | 0 of 13 agree with the abstract |
| Indirect check | Results, "Integration..." | — | miR-425-3p and miR-638 are higher in VT/VN, and high levels go with more Roseburia sp. CAG 182; this fits Roseburia higher in VT/VN, not in O |
| Correction or erratum | Crossref, PMC, Europe PMC, PubMed | — | none found |
The thirteen entries are not thirteen independent analyses. The Results sentence, the Discussion and Figure 3A all describe the same Wilcoxon comparison, and Figure 3C is a separate (DIABLO) view of the same subjects. The point of the count is that the body of the paper is internally consistent and the abstract sentence is the only exception.
Figure
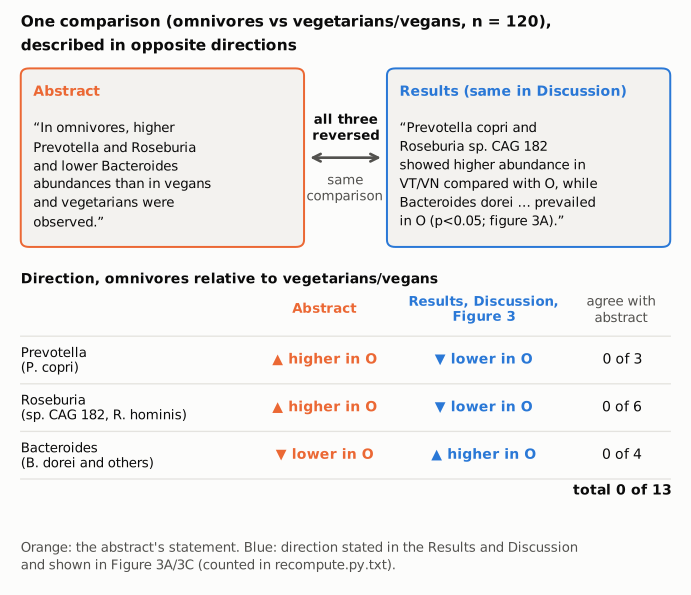
Figure 1. Top: the abstract sentence (orange) and the Results sentence it summarises (blue), both verbatim; they describe the same comparison of omnivores with vegetarians and vegans among the 120 subjects. Bottom: the direction for each genus as the abstract gives it (orange) and as the Results, Discussion and Figure 3A/3C give it (blue). The right-hand column counts how many of the paper's own statements and displays agree with the abstract for each genus (0 of 3, 0 of 6, 0 of 4; 0 of 13 in total, from recompute.py.txt). The figure shows no data values, because the paper reports none for these taxa.
Why it matters
- The abstract states the opposite of the paper's result. For all three genera the direction in the abstract is the reverse of what the Results text, the Discussion and Figure 3 report. Readers who see only the abstract, for example in PubMed or in literature databases that index abstracts, receive the reversed finding.
- It also clashes with the next sentence of the abstract. The abstract goes on to say that miR-425-3p and miR-638 were associated with "increased abundances of microbial species, such as Roseburia sp. CAG 182 ... specific of different diets". In the body those miRNAs are higher in VT/VN and track higher Roseburia sp. CAG 182, which only fits Roseburia being higher in VT/VN. Read together, the two abstract sentences imply a link between omnivory and Roseburia that the paper's data contradict.
- The body's direction matches prior literature; the abstract's does not. The paper's own data (higher Prevotella with plant-based diets, higher Bacteroides with an omnivorous diet) are in line with earlier studies linking these taxa to fibre-rich and animal-rich diets. The abstract's version runs against that literature, so a reader could take it as a new and contrary finding.
- The analysis and the main conclusions are not affected. The error sits in one abstract sentence. The 49 differentially expressed miRNAs, the miR-636 and miR-4739 associations with diet duration, the nutrient correlations, the integrated model (AUC 0.89) and the Conclusion do not depend on it. The diet–microbiome contrast is a secondary result of a paper about stool miRNAs.
Explanations considered
- Genus in the abstract, species in the body. Does not explain it. The only taxa of these genera reported as differing by diet are P. copri, Roseburia sp. CAG 182 and B. dorei (Figure 3A shows exactly these three), and the abstract's genus names summarise them. The Discussion itself uses the genus name in the body's direction ("Roseburia and R. bacterium D5, which in our cohort were significantly more abundant in VT/VN"). The other Roseburia and Bacteroides species shown in Figure 3C (R. hominis, B. finegoldii, B. massiliensis) also go the body's way.
- A different comparison or cohort. Does not explain it. The abstract compares omnivores with vegans and vegetarians, which is the O vs VT/VN comparison of Figure 3A in the same 120 subjects. The independent validation cohort of 45 omnivores contributed stool miRNA data only, and no other microbiome comparison by diet is reported.
- The miRNA-quartile analyses. Do not apply. Figure 3F and the related text group subjects by miR-425-3p or miR-638 level "regardless of the type of diet", not by diet, so they cannot be the source of a statement about omnivores versus vegans and vegetarians.
- A reference-group convention (e.g. "lower in VT/VN" phrased from the other side). Not supported. No such convention is stated in the Methods or figure legends, and the abstract sentence names its reference group explicitly ("In omnivores, higher ... than in vegans and vegetarians").
- The body, not the abstract, is wrong. Not supported. The Results text, two Discussion passages, the Figure 3A box plots with their significance marks and the Figure 3C bar colours all agree with one another, and the miRNA–Roseburia chain in the Results is coherent only with the body's direction. The abstract sentence is the only place with the reversed direction.
- A text-conversion artifact. Ruled out. The discrepancy is in words ("higher", "lower"), not in signs, superscripts or table cells, and the same sentence appears in the PMC archive, the PubMed record and the publisher's typeset PDF.
- A correction already issued. None found (see Status).
Status
- Version of record. doi.org resolves to gut.bmj.com, which returned HTTP 403 to automated requests. I checked the publisher's typeset PDF (Gut 2022;71:1302–1314, 13 pages, as deposited in an institutional repository, iris.unito.it), the PMC archive, the live PMC page, the Europe PMC full-text XML and the PubMed record (PMID 34315772). All carry the abstract sentence and the Results and Discussion passages exactly as quoted. The article was published online in 2021 and in print in July 2022 (volume 71, issue 7).
- Supplements. The Europe PMC supplementary bundle holds five supplement PDFs and the four main figures.
supp001.pdf(supplementary methods and legends, 11 pages) does not mention Prevotella, Roseburia, Bacteroides or Phocaeicola;supp002tosupp005are Supplementary Figures 1 to 4 as single images; by their legends they show food and nutrient intake, miRNA analyses and (Supplementary Figure 4) taxon abundances grouped by miRNA level, not by diet. No abundance table for these taxa by diet is supplied. The main Figure 3 image was examined and supports the body's direction (panels A and C). - Corrections and comments. As of 2026-10-24 I found no correction, erratum, expression of concern or retraction.
src/known.pyreturns no Crossref update relations, no PMC notices and no Europe PMC notices; the Crossref record has no update-to or updated-by entries. The PubMed record lists only two "CommentIn" entries (a Gut commentary, PMID 34479951, and a Hepatobiliary Surgery and Nutrition commentary, PMID 35464286), neither a correction. The PubPeer API returned no record (HTTP 404) for the DOI, and a web search for the title with "PubPeer" found no thread. - Sources. PMC article PMC9185830; Europe PMC full-text XML and supplementary files; typeset PDF of Gut 2022;71:1302–1314; PubMed 34315772; Crossref; PubPeer; https://doi.org/10.1136/gutjnl-2021-325168.
Suggested correction
In the Results paragraph of the abstract, replace
In omnivores, higher Prevotella and Roseburia and lower Bacteroides abundances than in vegans and vegetarians were observed.
with
In omnivores, lower Prevotella and Roseburia and higher Bacteroides abundances than in vegans and vegetarians were observed.
or, to match the species-level wording of the Results, "In vegans and vegetarians, higher Prevotella copri and Roseburia sp. CAG 182 and lower Bacteroides dorei abundances than in omnivores were observed." No change to the Results, Discussion, figures or conclusions is needed.