← Back to the plain-language case
Chi-square P = 0.0379 for casein B-cell responders does not follow from 19/45 vs 10/35
Proc Natl Acad Sci U S A (2022) · doi:10.1073/pnas.2117034119 · PMC8916005
Summary
The paper reports that more patients with multiple sclerosis (MS) than patients with other neurologic diseases (OND) had casein-specific B cells in an ELISPOT assay: 19/45 (42%) vs 10/35 (28%), "P = 0.0379; χ2 test". A chi-square test on those counts gives χ² = 1.59, P = 0.208. Fisher's exact test gives P = 0.246, and none of the eight other standard two-group tests tried comes below P = 0.10. The reported P is reproduced exactly (P = 0.03794) only when the printed percentages are entered as if they were counts out of 100 patients per group. This comparison is the only between-group support the paper gives for the B-cell half of the abstract's statement that patients with MS had "significantly higher B cell and antibody reactivity to bovine casein". The mouse experiments and the separate serum IgG ELISA comparison are not affected.
What the paper reports
The result itself:
"While the number of casein-specific B cell spots/patient was similar in the two patient groups, the number of patients positive for casein-specific B cells was higher in the MS (19/45; 42%) than in the OND group (10/35; 28%) (P = 0.0379; χ2 test)." (Results, "Patients with MS Harbor Bovine Casein-Specific Antibodies and B Cells", paragraph 3)
The group sizes are stated in the same paragraph, in the Methods and in Table 2:
"we tested the CNS- and casein-specific B cell response in patients with MS (n = 45) and those with ONDs (n = 35)" (Results, same paragraph)
"PBMCs from 45 patients with MS and 35 patients with ONDs were tested by ELISPOT assay." (Materials and Methods, "Patient Sample ELISPOT")
"ELISPOT | 35 | 45" and "ELISPOT casein responders, %† | 28 | 42" (Table 2, columns "Patients with ONDs" | "Patients with MS")
The claims that rest on this comparison:
"The results obtained from the mouse model were complemented by clinical data showing that serum samples from patients with MS contained significantly higher B cell and antibody reactivity to bovine casein than those from patients with other neurologic diseases." (Abstract)
"Patients with MS show elevated numbers of B cell responses and IgG titers to bovine casein in the blood." (Fig. 4 title)
The Statistical Analysis section lists the tests used and the significance level; it does not mention a chi-square test:
"differences between two parametric groups were assessed using an unpaired t test or paired t test while ANOVA was used for greater than two groups. For nonparametric datasets, a Mann–Whitney U test was used. For both parametric and nonparametric datasets, a significance level of 5% was chosen." (Materials and Methods, "Statistical Analysis")
What the paper's own numbers show
Method. The stated counts give the 2×2 table MS 19 positive / 26 negative and OND 10 positive / 25 negative (80 patients). recompute.py.txt runs the usual two-group tests for a difference in proportions on this table with scipy: Pearson chi-square with and without Yates' continuity correction, its one-sided version, the likelihood-ratio G-test, the N−1 chi-square, and Fisher's, Barnard's and Boschloo's exact tests. It then searches every 2×2 table with row totals 45 and 35 for one whose chi-square P (uncorrected or Yates) equals 0.0379. Finally it tries tests that are not two-group comparisons and a chi-square on the printed percentages entered as counts.
| Quantity | Location | Reported | Recomputed |
|---|---|---|---|
| MS responders | Results para 3; Table 2 | 19/45; 42% | 42.22% |
| OND responders | Results para 3; Table 2 | 10/35; 28% | 28.57% (29% with conventional rounding) |
| Difference in responder proportion | derived | 42% vs 28% | 13.7 percentage points; Newcombe 95% CI −7.5 to 32.6 |
| Pearson χ², no correction | Results para 3 | P = 0.0379 (χ2 test) | χ² = 1.588, df 1, P = 0.2077 |
| Pearson χ², Yates correction | Results para 3 | P = 0.0379 | χ² = 1.052, P = 0.3051 |
| Pearson χ², one-sided | Results para 3 | P = 0.0379 | P = 0.1038 |
| G-test / N−1 χ² | Results para 3 | P = 0.0379 | P = 0.2050 / 0.2105 |
| Fisher exact, two-sided / one-sided | Results para 3 | P = 0.0379 | P = 0.2463 / 0.1525 |
| Barnard / Boschloo exact, two-sided | Results para 3 | P = 0.0379 | P = 0.2326 / 0.2175 |
| χ² needed for P = 0.0379 (df 1) | derived | — | 4.31; observed 1.59 |
| Any table with row totals 45 and 35 giving P = 0.0379 | derived | — | none (closest: Yates P = 0.0373 for 17/45 vs 5/35, and 0.0384 for 23/45 vs 9/35) |
| Percentages entered as counts, 42/100 vs 28/100, Pearson χ² | derived | P = 0.0379 | χ² = 4.308, P = 0.037940 (exact match) |
| Same, 42/100 vs 29/100 (conventional rounding) | derived | — | P = 0.0547 |
| Same, with Yates correction | derived | — | P = 0.0539 |
| MS rate against a fixed rate of 10/35 or 0.28 (goodness of fit; binomial) | derived | — | P = 0.043 or 0.034; binomial P = 0.048 or 0.045 |
| ELISA OD > 1.0 rates, 16/39 vs 5/23 | Table 2 (no P given) | 41.02% vs 21.7% | χ² P = 0.1211; Fisher P = 0.1673 |
| Group sizes needed at the same proportions for P < 0.05 | derived | — | about 3 times larger (135/105: P = 0.029; 90/70: P = 0.075) |
The expected numbers of responders under no group difference are 16.3 (MS) and 12.7 (OND), against 19 and 10 observed. The four cell contributions to Pearson's statistic sum to 1.59, well short of the 4.31 needed for P = 0.0379. The 2×2 table is fully determined by the text and Table 2, and the table's row totals equal the totals in the Methods, so there is no unstated count that could be varied.
Figure
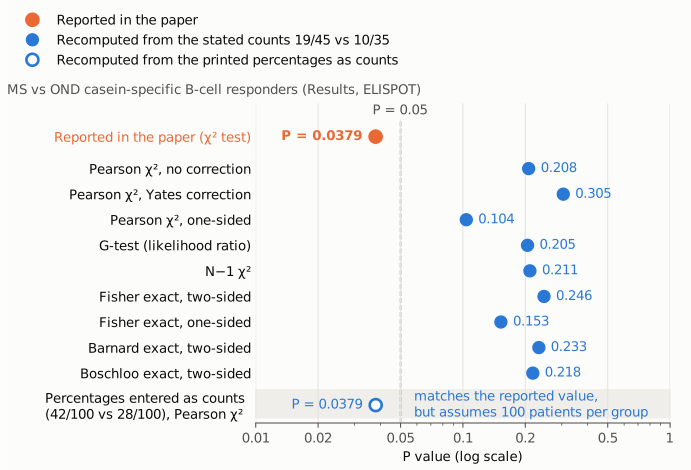
Figure 1. P values for the comparison of casein-specific B-cell responders, 19/45 (MS) vs 10/35 (OND), on one log-scaled axis. The orange point is the value reported in the Results (P = 0.0379, "χ2 test"). The filled blue points are nine standard two-group tests recomputed from the stated counts. All lie between 0.10 and 0.31, on the far side of the dashed line at the paper's stated 5% significance level. The open blue point in the shaded row is a Pearson chi-square run on the printed percentages as if each group had 100 patients (42/100 vs 28/100). It gives P = 0.0379, the reported value, to four decimals. All values come from recompute.py.txt.
Why it matters
The comparison changes from significant (as reported) to not significant (as recomputed) at the 5% level the paper sets. The recomputed 95% CI for the difference in responder proportions runs from −7.5 to +32.6 percentage points and includes zero. The same paragraph says that "the number of casein-specific B cell spots/patient was similar in the two patient groups", so the paper's ELISPOT data provide no between-group difference in B-cell reactivity that is statistically significant.
This affects the following statements:
- Abstract. "significantly higher B cell and antibody reactivity to bovine casein than those from patients with other neurologic diseases". The antibody half rests on the serum IgG ELISA (39 MS vs 23 OND, "P = 0.032; Mann–Whitney U test"), which this check does not touch. The B-cell half rests on the chi-square comparison alone.
- Fig. 4 title. "Patients with MS show elevated numbers of B cell responses". Fig. 4 itself shows the ELISA (panels A and B) and an MS-only correlation (panel C); the B-cell group contrast appears only in the text and Table 2.
- Table 2. The "ELISPOT casein responders, %" row (28 vs 42) is presented as a group contrast, without a P value.
- Translational conclusions. The paragraph closes with "these findings corroborated the link between casein- and MAG-specific antibodies and MS", and the Discussion calls for "personalized dietary restrictions". Without a significant B-cell difference, the human evidence that patients with MS differ from OND controls rests on the single ELISA comparison.
The direction of the observed difference is unchanged (42% vs 29%), and the data are compatible with a modest difference. They are equally compatible with none. At the observed proportions, about three times as many patients per group would have been needed for P < 0.05.
The main mouse findings do not depend on this test: casein immunization with demyelination and IgG deposition, MAG cross-reactivity shown with antibodies and adsorption, and complement dependence. Neither do the ELISA comparison (P = 0.032) or the MS-only correlation between CNS- and casein-specific spot counts (r = 0.605).
Explanations considered
- Continuity correction, or a one-sided test. Yates' correction raises P to 0.305. A one-sided Pearson test gives 0.104 and a one-sided Fisher test 0.153. None is near 0.0379.
- An exact or likelihood-based test labelled "χ2". The G-test, N−1 chi-square and Fisher's, Barnard's and Boschloo's tests give P = 0.205 to 0.246.
- Different or misprinted counts. The denominators 45 and 35 appear in the Results, the Methods and Table 2. The percentages match the counts (19/45 = 42.2%; 10/35 = 28.6%, printed as 28), so a misprint in the counts would also have to appear in the percentages. Across all 2×2 tables with row totals 45 and 35, no table gives P = 0.0379 to four decimals with or without Yates' correction. The nearest values (0.0373, 0.0384) need responder counts far from 19 and 10, such as 17/45 vs 5/35 with Yates' correction.
- The P value belongs to a different comparison. The other proportion contrast in Table 2, ELISA OD > 1.0 (41.02% of 39 vs 21.7% of 23, i.e. 16 vs 5), gives P = 0.121 (Fisher 0.167). The ELISA titer comparison has its own reported P (0.032), and the spot counts per patient are described as "similar". None of these accounts for 0.0379.
- A one-sample test against the OND rate. Comparing the MS count with a fixed rate of 10/35 or 0.28 gives P = 0.034 to 0.048 (goodness of fit or binomial), never 0.0379. Such a test also treats the OND estimate as known without error, so it is not a valid two-group comparison.
- Percentages entered as counts. A Pearson chi-square without correction on 42/100 vs 28/100 gives χ² = 4.308, P = 0.037940, which matches the reported value to all four printed decimals. This also fits the printed 28% (with 29%, P = 0.0547). The paper does not describe how the test was run, so this is a numerical match, not a documented procedure. Even so, the calculation treats 80 patients as 200 and is not a valid analysis of the stated data. It explains where the number could come from; it does not make the number correct.
- Text-conversion artifact. The counts and P value are plain text with ordinary decimal points. They read identically in the PMC archive and the Europe PMC full-text XML, with no minus signs, superscripts or table cells involved.
Status
As of 2026-10-23:
- Version of record. The publisher's page (pnas.org, reached through doi.org) returned HTTP 403 to automated access and could not be read. The archived full text in PubMed Central (PMC8916005) and the Europe PMC full-text XML carry the identical sentence, counts and P value, and Table 2 matches.
- Supplement. The SI Appendix (pnas.2117034119.sapp.pdf, from the Europe PMC supplementary-files archive) was converted to text and searched. Tables S3 and S4, which the paragraph cites, list patient characteristics (diagnosis, sex, age, disease duration, EDSS, dairy intake) but not per-patient ELISPOT results or responder status. The SI contains no "ELISPOT", "chi" or "χ". The data availability statement points to the article and SI; no source-data file was found. The supplement does not resolve the discrepancy.
- Corrections. None found. Crossref update and relation metadata are empty, and a Crossref
updates:filter on the DOI returns 0 items. Crossref carries Retraction Watch entries, and none appear. The PMC and Europe PMC notice lists are empty, Europe PMC has no comment/correction list, and PubMed (PMID 35235454) has no CommentsCorrections entries. - PubPeer. PubPeer's site and API refused automated access (HTTP 403 and 429), so it could not be searched directly. An earlier web search found no PubPeer thread for the article. A PubPeer comment therefore cannot be fully ruled out.
Sources: PMC full text via src/show.py PMC8916005; src/known.py 10.1073/pnas.2117034119; api.crossref.org; Europe PMC REST (search, fullTextXML, supplementaryFiles); PubMed E-utilities.
Suggested correction
In Results, "Patients with MS Harbor Bovine Casein-Specific Antibodies and B Cells", paragraph 3, the sentence could read: "the proportion of patients positive for casein-specific B cells was 42% (19/45) in the MS group and 29% (10/35) in the OND group; this difference was not statistically significant (P = 0.21, χ2 test; Fisher's exact test P = 0.25)." Reporting the difference with its 95% CI (13.7 percentage points, −7.5 to 32.6) would show the uncertainty.
Consequential changes:
- Abstract. Limit "significantly higher" to the antibody (ELISA) result, e.g. "...contained significantly higher antibody reactivity to bovine casein..., and a numerically, but not significantly, higher proportion had casein-specific B cells."
- Fig. 4 title. Remove "elevated numbers of B cell responses" or qualify it.
- Table 2. Optionally add counts to the "ELISPOT casein responders" row (10/35, 29%; 19/45, 42%).
- Statistical Analysis. Add the chi-square (or Fisher) test, since the section currently lists only t tests, ANOVA, Mann–Whitney and Pearson correlation.