← Back to the plain-language case
The 2019 overall adolescent YLL is 11 494 below boys plus girls, understating the five-year total
JAMA Pediatr (2022) · doi:10.1001/jamapediatrics.2021.6032 · PMC8804970
Summary
The paper's single Table gives years of life lost (YLL) to unintentional drug overdose by year and sex. For adolescents (10-19 years) in 2019 it prints an overall YLL of 27 919.85, but the boys and girls cells in the same row add up to 26 711.99 + 12 701.86 = 39 413.85. In the other nine year-rows of the Table, the overall cell equals boys plus girls to the cent. The adolescent five-year total of 187 077.92, printed in the Total row and in the Results, is the sum of the overall column with the 2019 cell as printed. The paper's own boys and girls totals add up to 198 571.92, and its stated annual mean (SD) of 39 714.38 (2689.63) and its Discussion figure of "nearly 200 000 YLL" both match 198 571.92, not 187 077.92. The stated adolescent total is therefore 11 494.00 YLL (5.8%) too low, and the printed 2019 cell shows a 24.6% fall in adolescent YLL from 2018 to 2019 where the paper's own sex-specific numbers show a 6.4% rise. The paper's conclusions do not change.
What the paper reports
Table, "Annual Mortality Due to Unintentional Drug Overdose Among Adolescents and Young People, 2015-2019", adolescents section. Columns are Year | Boys/men deaths, No. | Boys/men YLL | Girls/women deaths, No. | Girls/women YLL | Overall deaths, No. | Overall YLL:
2018 | 407 | 23 910.59 | 207 | 13 117.02 | 614 | 37 027.61
2019 | 455 | 26 711.99 | 199 | 12 701.86 | 654 | 27 919.85
Total | 2267 | 133 023.64 | 1029 | 65 548.28 | 3296 | 187 077.92
Table footer (the only footnote):
Abbreviation: YLL, years of life lost.
Methods:
YLL were calculated as standard life expectancy minus age at death. Male and female life expectancy at each individual age was determined from the 2017 Social Security Administration Period Life Table.
Results, first paragraph:
Male adolescents outnumbered female adolescents in incident deaths (2267 [68.8%] vs 1029 [31.2%]) and YLL (133 023.64 vs 65 548.28). Annual total YLL due to unintentional drug overdose was stably elevated with a mean (SD) 39 714.38 (2689.63) annual YLL (Table). Adolescents experienced a total of 187 077.92 YLL during the study period.
Results, second paragraph:
Young people experienced a total of 1 227 223.58 YLL during the 5-year period of study.
Discussion, first sentence:
Over the 5-year period of this cross-sectional study, adolescents experienced nearly 200 000 YLL, and young people amassed greater than 1.25 million YLL.
What the paper's own numbers show
Method. YLL and deaths are counts summed over decedents, so for each year the overall cell should equal the boys/men cell plus the girls/women cell. I checked this for every year-row of both age groups, summed every column and compared it with the printed Total row, and recomputed the annual mean and SD of the adolescent overall YLL series two ways: from the overall column as printed, and from boys plus girls in each row. I also computed YLL per death for each adolescent year as a check on scale. All inputs are copied from the Table and text. Every number below is printed by recompute.py.txt.
| Quantity | Location | Reported | Recomputed from the paper's own numbers |
|---|---|---|---|
| Adolescent overall YLL, 2019 | Table, 2019 row, Overall YLL | 27 919.85 | 39 413.85 (26 711.99 + 12 701.86); printed cell is 11 494.00 lower |
| Adolescent overall YLL, 2015-2018 | Table, Overall YLL | 38 464.60; 44 187.60; 39 478.26; 37 027.61 | identical to boys + girls (difference 0.00 in each year) |
| Adolescent overall deaths, 2019 | Table, 2019 row | 654 | 654 (455 + 199) |
| Adolescent five-year total YLL | Table Total row; Results | 187 077.92 | 198 571.92 (133 023.64 + 65 548.28); 187 077.92 is the sum of the printed overall column, including the 2019 cell |
| Boys and girls total YLL | Table Total row; Results | 133 023.64; 65 548.28 | 133 023.64; 65 548.28 (column sums agree) |
| Annual mean (SD) of adolescent YLL | Results | 39 714.38 (2689.63) | 39 714.38 (2689.63) from boys + girls per year (sample SD); 37 415.58 (5948.42) from the printed column |
| Adolescent total, Discussion | Discussion | "nearly 200 000 YLL" | 198 571.92 is 99.3% of 200 000; 187 077.92 is 93.5% |
| Change in adolescent YLL, 2018 to 2019 | Table | 37 027.61 to 27 919.85 (implied −24.6%) | 37 027.61 to 39 413.85 (+6.4%) |
| Adolescent YLL per death, 2019 | Table | 27 919.85 / 654 = 42.69 | 39 413.85 / 654 = 60.27; other years 60.29, 60.20, 60.18, 60.31 |
| Young people, every year and Total | Table, young people section | e.g. 2019: 236 273.30; Total 1 227 223.58 | all match men + women and the column sums |
| Male share of deaths | Results | 68.8% vs 31.2% (adolescents); 71.9% vs 28.1% (young people) | 68.8% vs 31.2%; 71.9% vs 28.1% |
The Table is internally consistent everywhere except one cell. Every other row adds across, every column adds down to its Total, and the death counts in the 2019 row add correctly. The 2019 adolescent overall YLL is the only exception. Two further checks in the paper's own text favor 39 413.85 over the printed value. The Results give an annual mean and SD that reproduce to the cent only from the boys-plus-girls series (39 714.38 × 5 = 198 571.90), and the YLL per death in 2019 is about 60.3 with the boys-plus-girls value, as in every other year, but 42.7 with the printed value. The difference between the printed and recomputed cells is a whole number, 11 494.00, and the two values share the decimals .85.
Figure
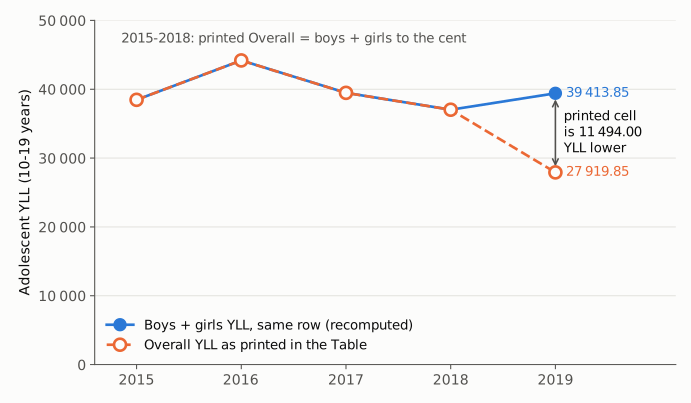
Figure 1. Adolescent (10-19 years) unintentional overdose YLL by year, on an axis starting at zero. Blue filled circles and solid line: boys YLL plus girls YLL in each row of the Table, recomputed. Orange open circles and dashed line: the Overall YLL column as printed. From 2015 to 2018 the two series are identical to the cent, so the markers overlap. In 2019 the printed cell is 27 919.85 and boys plus girls is 39 413.85, a gap of 11 494.00 YLL. Read at face value, the printed column shows a fall of 24.6% from 2018 to 2019; the paper's sex-specific cells show a rise of 6.4%. All values are from the Table or from recompute.py.txt.
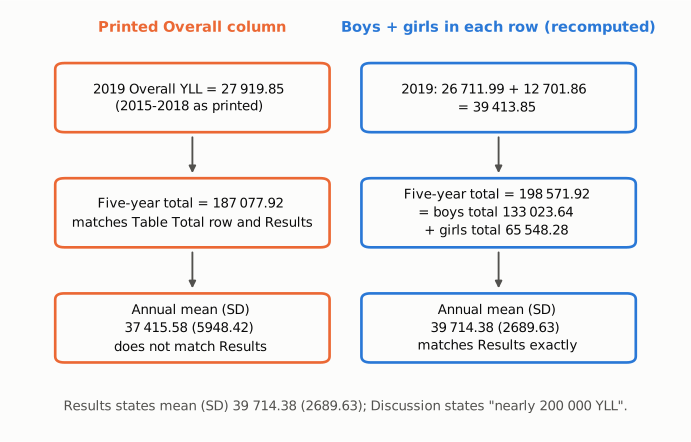
Figure 2. Calculation flow. Left (orange): starting from the Overall YLL column as printed, the five-year sum is 187 077.92, which is the total in the Table and the Results, and the annual mean (SD) is 37 415.58 (5948.42). Right (blue): replacing the 2019 cell by boys plus girls (39 413.85), the five-year sum is 198 571.92, equal to the printed boys total plus the printed girls total, and the annual mean (SD) is 39 714.38 (2689.63), exactly the values in the Results. The Discussion's "nearly 200 000 YLL" also fits the right-hand total. The paper's stated total and its stated mean therefore come from different versions of the 2019 cell.
Why it matters
- A stated total is wrong in two places. The Results sentence "Adolescents experienced a total of 187 077.92 YLL during the study period" and the Table's Total row both understate the paper's own adolescent burden by 11 494.00 YLL (5.8%). The figure the paper's inputs support is 198 571.92.
- The paper contradicts itself. Within one paragraph of the Results, the annual mean of 39 714.38 implies a total of 198 571.90, while the next sentence gives 187 077.92. A reader cannot tell from the text which is right without redoing the arithmetic.
- The printed 2019 cell suggests a trend that is not in the data. Taken at face value, the overall column makes 2019 the lowest year by a wide margin, a 24.6% fall from 2018. The paper's sex-specific cells show a 6.4% rise, in line with the text's description of YLL as "stably elevated". Anyone extracting the overall series for trend analysis or for a meta-analysis would carry the false fall forward.
- The conclusions stand. The adolescent death counts (3296), the sex-specific YLL, the male predominance, the stated mean (SD), all young-people YLL figures and the Discussion's "nearly 200 000 YLL" are unaffected. The paper tests no hypotheses, so no inference changes. The error is one table cell and the total built on it.
Explanations considered
- "Overall" is computed differently from boys plus girls (for example with a pooled, sex-combined life table). Not supported. The Methods describe only sex-specific life expectancies from the 2017 Social Security Administration Period Life Table and give no separate method for the overall column. In the other nine year-rows (adolescents 2015-2018, young people 2015-2019), overall equals boys plus girls to the cent, and the young-people Total does too. A different method would not give exact additivity in nine rows and a 29% shortfall in one.
- A different population, age band or subset in the 2019 overall cell. Not supported. The 2019 overall death count is 654 = 455 + 199, so the cell covers the same decedents as the sex-specific cells. The Table's only footnote is an abbreviation and sets out no exception for 2019.
- The sex-specific 2019 cells, not the overall cell, are wrong. Not supported. The boys and girls columns sum to the printed boys and girls totals (133 023.64 and 65 548.28), which the Results also quote. Their sum, 198 571.92, is the total that the Results mean (SD) and the Discussion's "nearly 200 000" imply. YLL per death in 2019 is 60.27 with the sex-specific values, matching 60.18 to 60.31 in the other years.
- Rounding. Ruled out. The gap is 11 494.00, against differences of exactly 0.00 in every other row.
- A text-conversion or table-alignment artifact. Ruled out. The publisher's full text, the PMC HTML page and the Europe PMC JATS XML give the same values. In the XML, each value is in its own table cell in column order, so the 2019 overall YLL is not shifted from another column or row.
- A correction already issued. None found (see Status).
- Side observation, not part of the main finding. The Discussion says young people "amassed greater than 1.25 million YLL", but the Table and Results give 1 227 223.58 YLL for young people, which is less than 1.25 million. The Table's young-people figures are internally consistent, so this concerns only the wording of the Discussion.
Status
- Version of record. The publisher's full text (doi.org/10.1001/jamapediatrics.2021.6032, which resolves to jamanetwork.com/journals/jamapediatrics/fullarticle/2788490) has the same adolescent 2019 row (455 | 26 711.99 | 199 | 12 701.86 | 654 | 27 919.85), the same Total row and the same Results sentence as the PMC copy. The PMC HTML page and the Europe PMC full-text XML agree. Every quotation above was checked verbatim against the PMC-archived text with
src/show.py. - Supplements. None. This is a research letter (pages 415-417); the publisher page lists no supplement, and the PMC and Europe PMC records have no supplementary material. The source data are public CDC WONDER multiple-cause-of-death files, but individual-level ages at death are not published, so the YLL cannot be rebuilt independently. The check here relies only on the paper's own numbers.
- Corrections and comments. As of 2026-10-24 I found no correction, erratum, retraction or expression of concern.
src/known.pyreturns no Crossref update relations and no PMC or Europe PMC notices; the Crossref record has no update-to, updated-by or relation entries. PubMed (PMID 35099529) lists no erratum, only a linked letter (doi:10.1001/jamapediatrics.2022.1171) and reply (doi:10.1001/jamapediatrics.2022.1174), JAMA Pediatr 2022;176(7):729, which concern race-specific overdose trends; the reply does not mention the Table or revise any YLL figure. The publisher page shows no correction notice. PubPeer has no comments on the article, and Retraction Watch has no matching item. The Europe PMC search endpoint returned HTTP 503 on three attempts; the Europe PMC notices check throughsrc/known.pyreturned empty. - Sources. PMC article PMC8804970; https://pmc.ncbi.nlm.nih.gov/articles/PMC8804970/; Europe PMC full-text XML for PMC8804970; https://doi.org/10.1001/jamapediatrics.2021.6032 (publisher full text); Crossref API record; PubMed PMID 35099529; doi:10.1001/jamapediatrics.2022.1171 and doi:10.1001/jamapediatrics.2022.1174; PubPeer; Retraction Watch.
Suggested correction
In the Table, adolescents section, change the 2019 Overall YLL from
27 919.85
to
39 413.85
and the Total row Overall YLL from
187 077.92
to
198 571.92
In the Results, change
Adolescents experienced a total of 187 077.92 YLL during the study period.
to
Adolescents experienced a total of 198 571.92 YLL during the study period.
These values follow from the paper's own sex-specific cells and agree with its stated mean (SD) and with the Discussion. The authors may wish to confirm the 2019 value against their source data. They may also wish to check the Discussion's "greater than 1.25 million YLL" for young people against the 1 227 223.58 YLL in the Table and Results, for example by changing it to "more than 1.2 million YLL".