← Back to the plain-language case
Kilkari birth-timeliness effect: abstract CI conflicts with Table 5, whose P = 0.03 contradicts its CI
BMJ Glob Health (2021) · doi:10.1136/bmjgh-2021-005489 · PMC8728358
Summary
The Abstract reports that exposure to Kilkari immunisation calls was significantly associated with timely vaccination at birth, with a probit coefficient of 0.08 and a 95% CI of 0.08 to 0.24. A lower limit equal to the point estimate is not possible for a probit coefficient. The Results text and Table 5 give the same estimate as 0.08 (−0.08 to 0.24), an interval that includes zero, yet Table 5 prints P = 0.03. Back-calculated from that interval, the Wald test gives z = 0.98 and P = 0.33. The same check reproduces the printed P value in 127 of the 130 cells of Table 5, including the other four Kilkari cells, and the Kilkari birth cell is the only one where the printed P and the CI disagree about significance. So the paper's own numbers do not establish that the birth-timeliness effect is statistically significant. That effect is one of the paper's two positive Kilkari findings, and the Abstract, Discussion and Conclusion all state it.
What the paper reports
Abstract, Results:
Exposure to Kilkari content on immunisation was significantly associated with an increase in men’s knowledge (but not women’s) about child immunisation (OR: 1.23, 95% CI 1.02 to1.48) and an increase in the timeliness of the child receiving vaccination at birth (Probit coefficient: 0.08, 95% CI 0.08 to 0.24).
Abstract, Conclusion:
Mobile messaging programmes, supported by mass media messages, may provide one important source for bolstering awareness, uptake and timeliness of immunisation services.
Results, "Immunisation knowledge", paragraph 6:
Timely immunisation at birth was significantly associated with listening to ≥50% of the cumulative content of Kilkari immunisation calls (0.08, –0.08 to 0.24) as well as higher women’s knowledge scores (0.05, 0.02 to 0.08).
Table 5 title:
Table 5 Results of Heckman two-stage analysis of determinants of timely immunization (by vaccination time-groups)
Table 5, Kilkari row. Each time-group has three columns, headed "Odds Ratio", "95% CI" and "P value" (N=3230). The Birth triplet comes first, followed by 6–10 weeks, 10–14 weeks, 14–18 weeks and 9–10 months:
Listening to >=50% immunisation calls | 0.08 | -0.08 to 0.24 | 0.03 | 0.01 | -0.14 to 0.16 | 0.87 | 0.15 | 0.00 to 0.29 | 0.05 | 0.13 | -0.03 to 0.30 | 0.12 | 0.08 | -0.07 to 0.22 | 0.32
Methods, "Data analysis > Immunisation practice":
The analysis of determinants of full immunisation and timely immunisation of basic and comprehensive package, vaccination at birth, at 6–10 weeks, 10–14 weeks, 14–18 weeks and 9–10 months were done using Heckman probit model.
Discussion, first paragraph:
It was also associated with higher likelihood of children 0–12 months receiving birth vaccines on time but had no association with overall full and timely immunisation for the basic or comprehensive immunisation package.
Discussion, "Determinants of immunisation coverage":
Kilkari exposure was not associated with overall improvements of full and timely immunisation coverage but did increase timely immunisation at birth. This finding may be linked to the timing of Kilkari calls and parental listening patterns.
Conclusion:
While this intervention increased father’s knowledge and improved the timeliness of immunisation at birth, it did not increase mother’s knowledge, nor did it improve overall child (0–12 months) immunisation completeness and timeliness.
What the paper's own numbers show
Method. In a probit model the coefficient is on the scale of the linear index, so a 95% Wald interval is b ± 1.96·SE and is symmetric around b. The standard error can therefore be recovered from the printed limits as SE = (upper − lower) / (2 × 1.96), with z = b / SE and two-sided P = 2·(1 − Φ(|z|)). I applied this to every cell of Table 5: 26 rows × 5 time-groups = 130 estimates. For each cell I also computed the full range of the Wald P over the rounding of the estimate and both limits (±0.005, or ±0.05 where a limit is printed to one decimal, for example "-0.0"). I counted a printed P as consistent if its own rounding interval overlaps that range. I then asked what interval P = 0.03 would require at b = 0.08. The Table 3 odds ratio quoted in the Abstract was checked the same way on the log scale. Every number below is printed by recompute.py.txt.
| Quantity | Location | Reported | Recomputed from the paper's numbers |
|---|---|---|---|
| Kilkari → timely birth vaccination: CI centring | Abstract | 0.08 (95% CI 0.08 to 0.24) | midpoint 0.16; distance from the estimate 0.00 below and 0.16 above, which cannot occur for a Wald CI |
| Same estimate: CI centring | Results para 6; Table 5, Birth | 0.08 (−0.08 to 0.24) | midpoint 0.080; 0.16 on each side, so the estimate and CI fit each other |
| Same estimate: P value | Table 5, Birth | P = 0.03 | SE = 0.0816, z = 0.98, Wald P = 0.327 (0.28 to 0.37 over rounding); one-sided P = 0.164 |
| CI that P = 0.03 would need at b = 0.08 | derived | −0.08 to 0.24 (SE 0.0816) | |z| = 2.17, SE = 0.0369, 95% CI 0.008 to 0.152; the printed CI implies an SE 2.2 times larger |
| Estimate that P = 0.03 would need with the printed CI width | derived | 0.08 | 0.177 (CI 0.017 to 0.337) |
| Kilkari, 6–10 weeks (control) | Table 5 | 0.01 (−0.14 to 0.16), P = 0.87 | Wald P = 0.896: consistent |
| Kilkari, 10–14 weeks (control) | Table 5 | 0.15 (0.00 to 0.29), P = 0.05 | Wald P = 0.043 (0.030 to 0.058): consistent |
| Kilkari, 14–18 weeks (control) | Table 5 | 0.13 (−0.03 to 0.30), P = 0.12 | Wald P = 0.123: consistent |
| Kilkari, 9–10 months (control) | Table 5 | 0.08 (−0.07 to 0.22), P = 0.32 | Wald P = 0.280 (0.234 to 0.327): consistent |
| All Table 5 cells | Table 5 | 130 estimates with CI and P | 127 consistent within rounding; 3 not: the Kilkari birth cell (0.03 vs 0.28 to 0.37), Poster/Newspaper/Handouts at 10–14 weeks (0.97 vs 0.79 to 0.94) and AWW at 9–10 months (<0.01 vs 0.011 to 0.020) |
| Cells where printed P < 0.05 but the Wald P is ≥ 0.05 across the whole rounding range | Table 5 | — | 1: the Kilkari birth cell |
| Kilkari → men's knowledge (OR) | Abstract; Table 3 | OR 1.23 (1.02 to 1.48), P = 0.03 | log-scale midpoint 1.229, Wald P = 0.029: consistent |
| Kilkari in Table 4 (full and timely, basic and all 19) | Table 4 | P = 0.74, 0.56, 0.12, 0.11 | Wald P = 0.685, 0.589, 0.142, 0.125: consistent |
The Table 5 CI and estimate for the Kilkari birth cell fit each other, and the same check works for the rest of the table. Only the printed P = 0.03 is out of line, by a factor of about 11 in P and 2.2 in |z|. The Abstract CI shares its upper limit (0.24) with Table 5, and its lower limit has the same magnitude as Table 5's with the opposite sign.
Figure
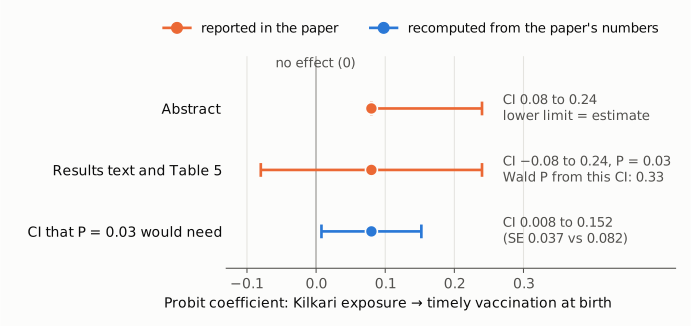
Figure 1. All three rows show the same estimate, the probit coefficient of 0.08 for listening to at least 50% of Kilkari immunisation content, with timely vaccination at birth as the outcome. The vertical line marks no effect (0). Orange rows are printed in the paper. In the Abstract the interval starts at the point estimate. In the Results text and Table 5 the interval runs from −0.08 to 0.24, crosses zero and implies a Wald P of 0.33, although Table 5 prints P = 0.03. The blue row is recomputed: it shows the 95% CI that P = 0.03 would require around the same estimate, 0.008 to 0.152, less than half the printed width. No two rows agree, so the paper's three statements about this estimate (Abstract CI, Table 5 CI, Table 5 P) cannot all be right.
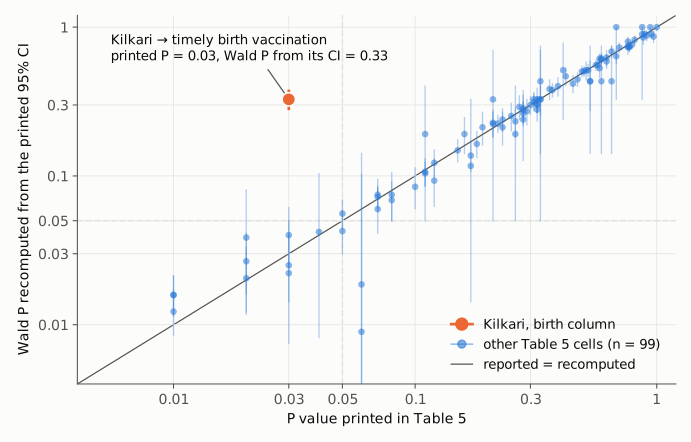
Figure 2. Each point is one cell of Table 5 that prints a numeric P value (100 of 130 cells; the other 30 print "<0.01"). The horizontal axis is the printed P. The vertical axis is the two-sided Wald P recomputed from the printed 95% CI, and the vertical bar is the range of that recomputed P over the rounding of the estimate and both limits. Both axes are logarithmic. The diagonal marks agreement, and the dashed lines mark 0.05. The 99 other cells lie on or near the diagonal, and their bars almost always reach it. The Kilkari birth cell (highlighted, labelled) sits far above it: printed P = 0.03, recomputed P = 0.33 (rounding range 0.28 to 0.37).
Why it matters
The paper's two positive findings for Kilkari are a higher immunisation knowledge score among fathers (OR 1.23, 1.02 to 1.48, which checks out at P = 0.029) and more timely vaccination at birth. The second appears in the Abstract's Results with an interval that excludes zero. The Results text calls it "significantly associated". The Discussion says Kilkari "did increase timely immunisation at birth" and explains the effect by the timing and listenership of the week-18 call. The Conclusion says the intervention "improved the timeliness of immunisation at birth". The Abstract's concluding sentence about bolstering "timeliness of immunisation services" relies mainly on this result, because Table 4 shows no association between Kilkari and overall timeliness (Wald P 0.142 and 0.125, printed 0.12 and 0.11).
The interval given in the body, −0.08 to 0.24, implies P ≈ 0.33. If that interval is correct, the data are compatible with no effect on birth-dose timeliness, the claims of a significant increase are not supported, and the Discussion's explanation for an effect at birth has nothing to explain. If instead the estimate and P = 0.03 are correct, the interval would be about 0.01 to 0.15. The effect would then remain significant and the printed CI would be wrong. The published record cannot tell these apart, and the Abstract interval matches neither. The direction of the estimate (positive, 0.08) is the same under every reading.
The finding that Kilkari had no association with overall full or timely immunisation (Table 4) is unaffected, and so is the association with fathers' knowledge (Table 3).
Explanations considered
- The Abstract quotes a different model, outcome or time-group. This does not account for the numbers. The Abstract labels the value a "Probit coefficient" for "vaccination at birth", which is the Birth column of Table 5 (Heckman two-stage, N = 3230). The Results text quotes the same estimate as 0.08 (–0.08 to 0.24). No other estimate of 0.08 for birth timeliness appears in the paper, and Table 4 covers overall completeness and timeliness, not the birth dose.
- Asymmetric interval from a transformation, bootstrap or profile likelihood. This does not account for the Abstract interval. Probit coefficients are reported on the linear-index scale, the paper's own CI for this estimate is symmetric (0.16 on each side), and an interval with zero width below the estimate cannot come from any of these methods. Rounding cannot produce it either.
- A minus sign lost in the Abstract. This would explain the Abstract interval exactly. The Abstract's lower limit has the same magnitude as Table 5's with the opposite sign, and the upper limits match. The same kind of discrepancy occurs elsewhere in the paper's tables. In Table 4, 9 of the 13 cells whose estimate lies more than 0.05 from its CI midpoint become centred if a positive upper limit is read as negative. One example is "Employed", printed in Table 4 as −0.28 (−0.38 to 0.18) and given in the Results text as "(-0.28, –0.38 to -0.18)". A lost sign does not explain the Table 5 P value.
- A conversion artifact in the archived text. This is excluded. The Europe PMC full-text JATS XML encodes the Table 5 minus sign as U+2212 and the Results-text minus as an en dash, while the Abstract string has no minus character at all. The Table 5 cells line up in five estimate / CI / P triplets, with no merged or shifted cells.
- Rounding of the printed values. This does not account for the P value. Over every combination of rounding of the estimate and both limits, the Wald P stays between 0.28 and 0.37.
- A one-sided test. This does not account for it. The one-sided P from the printed CI is 0.164.
- Table 5 P values computed with a method other than the Wald test (for example, a likelihood-ratio test or a different variance estimator). This is unlikely. The Wald check reproduces 127 of 130 Table 5 P values within rounding, including the other four Kilkari cells, and the two other mismatches are small and do not change any conclusion. A different method that matched every other cell but moved this one from 0.33 to 0.03 would be unusual.
- A one-digit slip in the P value. This is consistent with the numbers but not confirmed. The recomputed P rounds to 0.33, and the printed value is 0.03. If this is the explanation, the CI is right, the effect is not significant, and the text, Abstract, Discussion and Conclusion overstate it.
- The probit coefficients are mislabelled as odds ratios. The Table 5 column headers read "Odds Ratio" over values that include negative numbers, so the cells must be probit coefficients, as the Methods ("Heckman probit model") and the Abstract ("Probit coefficient") indicate; Table 4 heads the same kind of estimates "Coefficient". The header is a labelling error. It does not change the check, because the CI for an odds ratio would be symmetric on the log scale and could not contain negative values.
- The values are explained in a supplement. This is excluded. See Status.
Status
- Version of record. The publisher pages (gh.bmj.com, HTML and full-text PDF) returned HTTP 403 to automated access. I checked two independent renderings of the text BMJ deposited: the live PMC article (PMC8728358) and the Europe PMC full-text JATS XML (BMJ Glob Health vol. 6, Suppl 5, e005489). Both carry the Abstract, Results and Table 5 values quoted above. Every quotation above was confirmed verbatim against the PMC-archived text with
src/show.py. - Supplements. The only supplementary file, bmjgh-2021-005489supp001.pdf, contains Annexures 1–5: the Kilkari message content, the vaccination schedule, distributions of knowledge scores, distributions of full and timely immunisation, and the probit selection equation for having the MCP card. None reports the coefficient, SE, CI or P for the birth-timeliness outcome equation, and no data or code are provided.
- Corrections and comments. As of 2026-10-24 I found no correction, erratum, expression of concern or retraction. Crossref lists no update relations for the DOI. PMC and Europe PMC list no correction notices. The PubMed record (PMID 34312153) has no linked comments or corrections. A web search for corrections or comments found none. PubPeer could not be checked directly, because its search page returned HTTP 403 and its API returned 404 to automated requests.
- Sources. PMC article PMC8728358; Europe PMC full-text XML and supplementary files for PMC8728358; Crossref; PubMed (E-utilities) record 34312153; trial registration NCT03576157 (cited in the paper).
Suggested correction
- Report the correct coefficient, SE, 95% CI and P value for Kilkari exposure in the Birth column of Table 5, taken from the original model output. As printed, the CI (−0.08 to 0.24) implies P ≈ 0.33, while the printed P = 0.03 implies a CI of about 0.01 to 0.15.
- Correct the Abstract's interval ("95% CI 0.08 to 0.24"), whose lower limit equals the point estimate, so that it matches the corrected Table 5.
- If the corrected P is above 0.05, revise the Abstract's Results and Conclusion, the Results sentence ("significantly associated"), the Discussion ("did increase timely immunisation at birth" and the explanation that follows) and the Conclusion ("improved the timeliness of immunisation at birth").
- Relabel the Table 5 column headers from "Odds Ratio" to "Coefficient", as in Table 4.
- Check the sign of the CI limits throughout Table 4. Thirteen cells there have an estimate far from the midpoint of the printed interval, nine of them consistent with a lost minus sign on the upper limit. Also check the four wealth cells in the "All 19 vaccines" full-immunisation column, whose intervals (for example 0.00 to 0.07 around 0.23) do not contain the estimate.