← Back to the plain-language case
Primary-outcome 95% CI in the TICOSPA trial is incompatible with its reported p-values and sample size
Ann Rheum Dis (2021) · doi:10.1136/annrheumdis-2020-219585 · PMC8522451
Summary
The Results section gives the primary-outcome difference between arms (11.2 percentage points, 47.3% vs 36.1% of patients with at least 30% improvement in ASAS-HI) with a 95% CI of 8.5% to 13.9%. The same sentence calls the difference not statistically significant, with p=0.094 and p=0.079. That interval excludes zero. On the usual normal approximation it implies a standard error of 1.38 pp and p ≈ 4×10⁻¹⁶. The reported p-values instead imply standard errors of 6.4 to 6.7 pp and 95% CIs of about −1.3 to 23.7 pp and −1.9 to 24.3 pp. Three other sources agree with the p-values, not with the printed interval: the trial's size (80 patients per arm), the per-arm 95% CIs the authors later published in a reply to correspondence, and the post-hoc power the authors reported there. The non-significance conclusion is therefore supported. The printed interval, which is the only interval given for the primary outcome, overstates the precision of the estimate about five-fold.
What the paper reports
The estimated percentages of patients achieving an improvement ≥30% on the ASAS-HI at the 1 year visit with the ‘cluster and imbalance-adjusted model’ was 47.3% in the TC/T2T arm and 36.1% in the UC arm. The estimated difference (11.2%, 95% CI 8.5% to 13.9%) was not statistically significant in either model (p=0.094 and p=0.079 for the ‘cluster-adjusted’ and ‘cluster and imbalance-adjusted’ models, respectively).
— Results, Efficacy outcomes, paragraph 1
ASAS-HI significant improvement | 47.3% | 36.1% | NS | NS
— Table 2, primary-outcome row (columns: TC/T2T, UC, cluster-adjusted model, cluster and imbalance-adjusted model)
160 patients were included (80/group). [...] ASAS-HI improved by ≥30% in 47.3% of the TC/T2T arm and in 36.1% of those receiving UC (non-significant).
— Abstract
For an α risk of 5% and a β risk of 80%, with a bilateral test, 77 patients per arm were needed to demonstrate a 20-percentage-point difference among responders [...] For a uniform number of patients per centre, we aimed for a total sample of 160 patients (80 per arm).
— Methods, Sample size estimation, paragraph 1
The inflation factor for our study was 1.45, and thus the sample needed to take the cluster-randomised design into account was 232 patients (116 patients per arm).
— Methods, Sample size estimation, paragraph 2
In total, 144 patients (72 per arm) completed the last visit
— Results, Participant flow
The authors' published reply to correspondence (doi:10.1136/annrheumdis-2021-220913, first published 29 June 2021) adds per-arm intervals and a power calculation:
ASAS HI significant improvement | 47.3% (95% CI 36.2% to 59.0%) | 36.1% (95% CI 25.6% to 46.6%)
— Reply, table "Estimated outcomes at week 48% and 95% CI"
with p1=0.47 and p2=0.36 [...] and an α risk of 5%, the post-hoc-calculated power is 29.9%.
— Reply, paragraph 2
What the paper's own numbers show
Method. I treated the printed interval as a Wald interval: SE = half-width / 1.96. I backed each two-sided p-value out to z = Φ⁻¹(1 − p/2) and SE = 11.2 / z, and rebuilt the 95% CI as 11.2 ± 1.96·SE. As independent checks I used three more inputs: the binomial SE of a difference in proportions at the reported rates and arm sizes, the per-arm CIs in the authors' reply (SE taken from each half-width, arms combined as independent because clusters are nested within arms), and the reply's stated post-hoc power. All calculations are in recompute.py.txt.
| Quantity | Location | Reported | Recomputed |
|---|---|---|---|
| Difference in responders | Results, Efficacy outcomes | 11.2% | 47.3 − 36.1 = 11.2 pp (consistent) |
| Midpoint and half-width of the 95% CI | Results, Efficacy outcomes | 8.5% to 13.9% | midpoint 11.2, half-width 2.7 pp (symmetric, risk-difference scale) |
| SE, z and p implied by the printed CI | derived | — | SE 1.38 pp, z = 8.13, p ≈ 4.3×10⁻¹⁶ |
| Same, if the interval were ±1 SE / 90% / 99% | derived | "95%" stated | p = 3.4×10⁻⁵ / 8.9×10⁻¹² / 1.2×10⁻²⁶ (all significant) |
| 95% CI implied by p, cluster and imbalance-adjusted model | Results; Table 2 "NS" | p = 0.079 | z = 1.757, SE 6.38 pp, CI −1.3 to 23.7 pp |
| 95% CI implied by p, cluster-adjusted model | Results; Table 2 "NS" | p = 0.094 | z = 1.675, SE 6.69 pp, CI −1.9 to 24.3 pp |
| Ratio of p-implied SE to CI-implied SE | derived | — | 4.6 (p = 0.079) and 4.9 (p = 0.094) |
| Difference CI from the per-arm 95% CIs | Authors' reply, table | 36.2–59.0% and 25.6–46.6% | SE 5.82 and 5.36 pp → SE 7.91 pp, CI −4.3 to 26.7 pp, p ≈ 0.16 |
| Width of each per-arm CI vs the difference CI | Reply vs Results | 22.8 and 21.0 pp vs 5.4 pp | each arm's interval is about four times wider than the interval for the difference |
| Binomial SE, 80 per arm (no clustering) | Abstract (80/group) | — | SE 7.75 pp, CI −4.0 to 26.4 pp, p = 0.148 |
| Binomial SE, 72 per arm (completers) | Participant flow | — | SE 8.16 pp, CI −4.8 to 27.2 pp, p = 0.170 |
| Binomial SE × inflation factor 1.45 | Sample size estimation | — | SE 9.33 pp, CI −7.1 to 29.5 pp |
| Patients per arm needed for SE 1.38 pp | derived | 80 per arm | about 2529 per arm (5058 in total, against 160 randomised) |
| Post-hoc power, 80 per arm, p1 = 0.47, p2 = 0.36 | Authors' reply | 29.9% | 29.5% with binomial SE 7.74 pp; at SE 1.38 pp, power would be 1 − 3×10⁻¹⁰ |
| Post-hoc power, 116 per arm | Authors' reply | 41% | 40.2% with binomial SE 6.43 pp |
The two printed p-values, the per-arm intervals and the power figures in the reply, and the trial's size all point to an SE of roughly 6–8 pp for the difference. Only the printed 95% CI implies 1.38 pp.
Figure
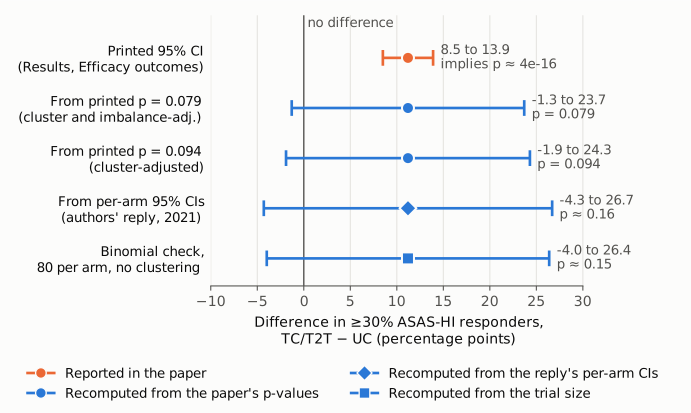
Figure 1. The primary-outcome difference (TC/T2T minus usual care, ≥30% ASAS-HI improvement, 11.2 pp) on one axis, with the null value 0 as a thin vertical line. Orange: the 95% CI printed in the Results (8.5 to 13.9 pp), which excludes zero and implies p ≈ 4×10⁻¹⁶. Blue, recomputed: the 95% CIs that correspond to the paper's own p-values, 0.079 (cluster and imbalance-adjusted model, −1.3 to 23.7 pp) and 0.094 (cluster-adjusted model, −1.9 to 24.3 pp); the CI obtained by combining the per-arm 95% CIs in the authors' reply (−4.3 to 26.7 pp); and an individual-level binomial check at 80 per arm with no allowance for clustering (−4.0 to 26.4 pp). Every recomputed interval includes zero and is 4.6 to 5.8 times as wide as the printed one.
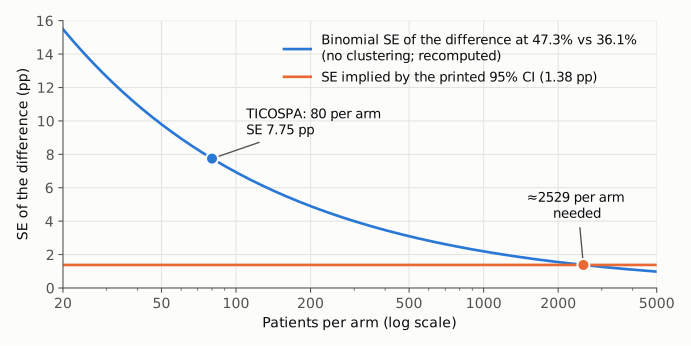
Figure 2. Standard error of a difference between 47.3% and 36.1% as a function of patients per arm (blue, binomial, no clustering), against the SE implied by the printed 95% CI (orange, 1.38 pp). TICOSPA had 80 patients per arm (SE 7.75 pp). An SE of 1.38 pp would need about 2529 per arm, before any inflation for cluster randomisation.
Why it matters
- The interval belongs to the trial's primary outcome, and it is the only interval reported for that outcome in the article (Table 2 gives only "NS").
- As printed, it describes a precisely estimated benefit of at least 8.5 pp. The intervals supported by the paper's own p-values run from about −1 to 24 pp, so the data are compatible with no effect and with a benefit about twice the point estimate. A reader who extracts the interval on its own, for example for a meta-analysis or a guideline evidence table, would take a non-significant result as a highly significant and precise one. In inverse-variance pooling it would also receive about 21 times its correct weight ((6.38/1.38)² ≈ 21).
- The Discussion compares the observed difference ("differed by 11% in favour of TC/T2T") with the 12% margin it cites from head-to-head trials. Read alongside the printed interval, the 11% difference looks tightly estimated. With an interval of roughly −1 to 24 pp, the data neither confirm nor exclude a difference of that size.
- What is not affected: the point estimate, its direction, and the headline conclusion that TC/T2T "was not significantly superior to UC for the primary outcome". The abstract, Table 2 and the conclusion follow the p-values, and the p-values agree with everything else.
Explanations considered
- A different confidence level. The text says 95%, and no other level appears for this interval. Read as ±1 SE, 90%, 99% or 99.9%, the interval still excludes zero with p of 3×10⁻⁵ or smaller. No confidence level reconciles it with p = 0.079 or 0.094.
- One-sided test. The sample-size section specifies a bilateral test. A one-sided p would also be smaller, which would widen the conflict, not resolve it.
- A different scale (odds ratio, risk ratio, log scale). The interval is centred exactly on 11.2, the difference 47.3 − 36.1, so it is on the risk-difference scale. An interval for a ratio would not be centred on the risk difference, and it would be compared with 1, not 0.
- The two models give different intervals. The interval follows the cluster and imbalance-adjusted estimates (47.3% and 36.1%). That model's own p = 0.079 implies an SE of 6.38 pp, 4.6 times the SE implied by the interval. The cluster-adjusted model is further away still.
- Covariate adjustment or clustering could narrow the interval. Cluster randomisation widens intervals; the paper's own inflation factor is 1.45. Covariate adjustment can narrow an interval modestly, but going from the unadjusted binomial SE of 7.75 pp to 1.38 pp would require the covariates to explain about 97% of the outcome variance. That model's own p-value (0.079) shows no such gain.
- A different quantity (for example a per-arm interval, or the interval for another outcome). The per-arm intervals the authors published later are 21–23 pp wide, not 5.4 pp, and the interval is centred on the difference. I found no other outcome in the article whose reported numbers produce 8.5 to 13.9.
- Conversion or typesetting error. The publisher's typeset PDF shows the same text. At 200 dpi there is no minus sign before 8.5, and the decimal points are ordinary. The PMC HTML, Europe PMC full text and PMC XML carry the same numbers. A lost minus sign would not explain it either: −8.5 to 13.9 is not centred on the reported 11.2.
- The p-values are the error and the CI is correct. This would make the trial strongly positive. It is ruled out by the trial's size (an SE of 1.38 pp would need about 2500 patients per arm), by the authors' own per-arm CIs, and by their post-hoc power of 29.9%, which reproduces only with an SE of about 7.7 pp.
None of these accounts for the printed interval. The p-values, the sample size and the later per-arm intervals agree with one another. The printed 95% CI is the outlier.
Status
As of 2026-10-24:
- Version of record: checked. The publisher's typeset PDF (Ann Rheum Dis 2021;80:1436–1444), obtained from the PMC open-access bucket, prints the same sentence on page 4 (Results, Efficacy outcomes) and "NS NS" in Table 2. The PMC HTML, Europe PMC full-text XML and the PMC XML match it. The publisher's site (ard.bmj.com) returned HTTP 403 to automated requests.
- Supplements: all seven online supplemental files were checked (treatment algorithm, cluster-level flow diagram, baseline imbalance table, economic evaluation, NSAID score and bDMARD initiation, observed secondary outcomes over time, protocol v5.0). None reports the model output, SE or CI for the primary outcome, so none of them settles the question.
- Corrections and retractions: none found. Crossref lists no update-to or updated-by relation; its only relation is an F1000 review (has-review). The PMC page shows no correction notice, and PubMed CommentsCorrections lists only "Comment in" links. The project's automated check (Crossref, PMC and Europe PMC notices) returned none.
- Published correspondence: the journal published two letters on this article (doi:10.1136/annrheumdis-2021-220904, Ann Rheum Dis 2023;82:e166; doi:10.1136/annrheumdis-2021-220938, 2023;82:e222) and an authors' reply (doi:10.1136/annrheumdis-2021-220913, 2023;82:e167). I read the reply in full from the open publisher's version in the Leiden University repository (hdl:1887/3247824). It gives per-arm 95% CIs and post-hoc power, but it does not mention the 8.5% to 13.9% interval and gives no CI for the difference. I could not open the text of the two letters (publisher HTTP 403), so I cannot say whether either one raises this interval. The reply was first published online on 29 June 2021. The final issue PDF (created 24 September 2021) still carries the original interval.
- PubPeer: searched. The PubPeer API returned a human-verification challenge, and web searches for the DOI and title found no PubPeer thread.
Suggested correction
Replace the interval in Results, Efficacy outcomes, paragraph 1, with the 95% CI for the difference that comes from the cluster and imbalance-adjusted mixed model, and state which model it comes from. Ideally, report the interval from the cluster-adjusted model as well. Going by the reported p-values, the corrected interval should be close to −1.3% to 23.7% (cluster and imbalance-adjusted, p = 0.079) and −1.9% to 24.3% (cluster-adjusted, p = 0.094). The exact limits must come from the model output, which only the authors hold. For example:
The estimated difference (11.2%, 95% CI [model-based lower limit, ≈ −1.3%] to [model-based upper limit, ≈ 23.7%]) was not statistically significant in either model (p=0.094 and p=0.079 ...).
No change is needed to the abstract, Table 2 or the conclusions. The Discussion's comparison of the 11% difference with a 12% margin could note that the interval includes both zero and differences of about twice that margin.