← Back to the plain-language case
VirtualSweet's reported cross-validation accuracy is impossible given its sensitivity and specificity; supplement shows best-fold values
Nucleic Acids Res (2021) · doi:10.1093/nar/gkab292 · PMC8262722
Summary
Table 1 reports 10-fold cross-validation results for the VirtualSweet model as accuracy 0.88, sensitivity 0.97 and specificity 0.96, and the text repeats the 88%. Accuracy is a prevalence-weighted average of sensitivity and specificity, so these three values cannot describe the same evaluation: with sensitivity 0.97 and specificity 0.96, accuracy must lie between 0.955 and 0.975 even allowing for rounding, and must be at least 0.920 even if the metrics are averages over folds. The paper's supplementary file S2 shows where the row comes from. Each Table 1 cross-validation entry matches the value S2 labels "best" for that metric, and these "best" values cannot all come from one fold. S2 gives the 10-fold mean VirtualSweet accuracy as 0.765 ± 0.114, not 0.88, so the cross-validation performance stated in Table 1, the text and the Conclusions is higher than the cross-validation average the paper's own supplement reports.
What the paper reports
Table 1, "Performance statistics for the VirtualTaste models applied to cross-validation and external validation sets" (excerpt, as archived in PMC):
VirtualTaste models | VirtualTaste models | VirtualSweet | VirtualBitter | VirtualSour
Data sampling method | Data sampling method | SMOTETC | SMOTE VDM | AugRandOS
Cross-validation | Prediction accuracy | 0.88 | 0.94 | 0.98
| Sensitivity | 0.97 | 0.94 | 0.94
| Specificity | 0.96 | 0.92 | 0.97
| ROC–AUC | 0.99 | 0.97 | 0.97
| F-measure | 0.87 | 0.94 | 0.98
External validation | Prediction accuracy | 0.89 | 0.90 | 0.97
| Sensitivity | 0.86 | 0.88 | 0.80
| Specificity | 0.92 | 0.97 | 0.99
| ROC-AUC | 0.95 | 0.96 | 0.99
| F-measure | 0.88 | 0.88 | 0.84
Materials and Methods, "VirtualTaste prediction models", VirtualSweet subsection:
The model achieved a prediction accuracy of 88% on 10-fold cross-validation and 89% on external validation. The AUC–ROC values of cross-validation and external validation are 0.95 and 0.99, respectively (Table 1).
Materials and Methods, "Performance evaluation of the VirtualTaste models", first paragraph:
Each model was validated using 8 different sampling methods for 10-fold cross-validation (22). The data was split into 10-fold, keeping the ratio of active and inactive data constant as published in our previous work (22).
Same section, definition of the metrics:
Prediction Accuracy is defined as the ability of a model to correctly predict the total number of activities and inactives. Sensitivity is the trained model's ability to correctly predict the positive (taste) class. Specificity is defined as the trained model's ability to correctly predict the negative (non-taste) class.
Same section, second paragraph:
The performance statistics both on cross-validation as well as external validation for the top- performing VirtualTaste models are summarized in Table 1. The models achieved a prediction accuracy of 88% and above on both, cross-validation and external validation. The specificity and sensitivity of the VirtualTaste models are balanced and scored 90% and above, except for the sensitivity of VirtualSweet (86%), VirtualBitter (88%) and VirtualSour (80%) on the external validation set.
Materials and Methods, "VirtualTaste prediction models", first paragraph:
The standard deviation and average of the accuracy and other parameters loss are computed (See Supplementary data).
Abstract:
The VirtualTaste models achieved an overall accuracy of 90% and an AUC of 0.98 in 10-fold cross-validation and in an independent test set.
Conclusions and Future Updates, first paragraph:
The models achieved a prediction accuracy of 88% and above both on cross-validation and external validation.
Supplementary file S2.xlsx (Sheet1), VirtualSweet block, row "SMOTETC", internal cross-validation cells (int. ROC-AUC, int. Acc, int. Sens, int. Spec, int. F-Measure):
0.833+/-0.124 | best:0.990 · 0.765+/-0.114 | best:0.877 · 0.740+/-0.185 | best:0.977 · 0.791+/-0.165 | best:0.963 · 0.751+/-0.129 | best:0.870
What the paper's own numbers show
Method. For a single binary evaluation with a share p of positives, accuracy = p × sensitivity + (1 − p) × specificity, so accuracy must lie between sensitivity and specificity for every p. I applied this check to all six rows of Table 1, widening every bound by ±0.005 for two-decimal rounding. For the case where the three metrics are each averaged over the 10 folds, I used the per-fold inequality accuracy ≥ min(sensitivity, specificity) ≥ sensitivity + specificity − 1, which carries over to the averages. I then compared each Table 1 entry with the supplementary file S2.xlsx for the sampling method Table 1 names (SMOTETC, SMOTEVDM and AugRandOS). Every number below is printed by recompute.py.txt.
| Quantity | Location | Reported | Recomputed from the paper's own numbers |
|---|---|---|---|
| VirtualSweet CV accuracy | Table 1; VirtualSweet subsection ("88%") | 0.88 | must lie in 0.960 to 0.970 for any prevalence (0.955 to 0.975 with rounding) given sensitivity 0.97 and specificity 0.96 |
| Prevalence needed for accuracy 0.88 | derived | — | p = (0.88 − 0.96) ÷ (0.97 − 0.96) = −8.0, which is impossible |
| Gap after allowing for rounding | derived | ≤ 0.885 | lowest possible accuracy 0.955; gap 0.070 |
| Lower bound if metrics are fold averages | derived | — | mean accuracy ≥ 0.965 + 0.955 − 1 = 0.920 |
| Balanced accuracy | derived | — | (0.97 + 0.96) ÷ 2 = 0.965 |
| VirtualSweet CV F-measure | Table 1 | 0.87 | fits sensitivity 0.97 and specificity 0.96 only at a positive share of 0.133, where accuracy is 0.961; at p = 0.5 F1 is 0.965 |
| Misclassified training compounds (n = 1608) | Datasets section | accuracy 0.88 → 193 | specificity and sensitivity ≥ 0.96 → at most 64 |
| Other five rows (CV Bitter, CV Sour, external Sweet, Bitter, Sour) | Table 1 | accuracy 0.94, 0.98, 0.89, 0.90, 0.97 | each within its sensitivity–specificity range; CV Sour (0.98 vs 0.94 and 0.97) only at the rounding edge (0.975) |
| VirtualSweet CV entries vs S2 "best" | Table 1 vs S2, SMOTETC | 0.88, 0.97, 0.96, 0.99, 0.87 | S2 "best": 0.877, 0.977, 0.963, 0.990, 0.870 (accuracy, sensitivity, specificity, AUC, F) |
| Can the S2 "best" values come from one fold? | S2, SMOTETC | — | No: with sensitivity 0.977 and specificity 0.963 a single fold's accuracy lies in 0.963 to 0.977, not 0.877 |
| VirtualSweet CV, 10-fold mean ± SD | S2, SMOTETC | — | accuracy 0.765 ± 0.114, sensitivity 0.740 ± 0.185, specificity 0.791 ± 0.165, AUC 0.833 ± 0.124, F 0.751 ± 0.129; the mean accuracy lies between the mean sensitivity and specificity, so these are mutually consistent |
| VirtualBitter and VirtualSour CV accuracy | Table 1 vs S2 | 0.94; 0.98 | S2 "best" 0.946 and 0.978; 10-fold means 0.845 ± 0.068 and 0.954 ± 0.092 |
| External-validation rows | Table 1 vs S2 | all 15 cells | all agree with the S2 external values to within 0.01, except VirtualBitter specificity (below) |
| VirtualSweet ROC-AUC, CV / external | text vs Table 1 vs S2 | text 0.95 / 0.99; Table 1 0.99 / 0.95 | S2: CV best 0.990 (mean 0.833), external 0.951; the text has the two values the other way round |
Table 1 thus reproduces the S2 "best" values for cross-validation and the single S2 values for external validation. For VirtualSweet, the "best" entries cannot all come from the same fold, because a fold with sensitivity 0.977 and specificity 0.963 cannot have accuracy 0.877. They must have been selected metric by metric. That explains why the printed row is impossible as a single evaluation. It also means the Table 1 "Cross-validation" row is not a cross-validation estimate in the usual sense, which is the average over folds. S2 gives that average for VirtualSweet as accuracy 0.765, which is 0.115 (about one fold SD) below the 0.88 in Table 1 and the text. S2 does not define "best", and it is not always the largest fold value: in two S2 rows the "best" value is below the mean (VirtualSour randOS accuracy, best 0.970 against mean 0.977, and, at the third decimal, VirtualSour AugRandOS sensitivity, 0.94 against 0.941).
The two-decimal Table 1 values follow the S2 values sometimes by rounding (0.877 to 0.88) and sometimes by truncation (sensitivity 0.977 printed as 0.97; VirtualBitter accuracy 0.946 printed as 0.94).
Figure
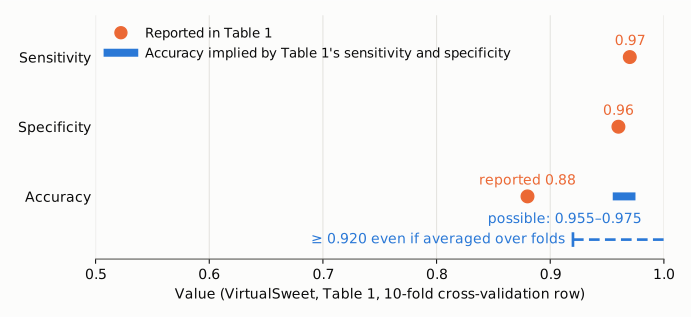
Figure 1. The VirtualSweet 10-fold cross-validation row of Table 1. Orange points are the printed sensitivity (0.97), specificity (0.96) and accuracy (0.88). The blue bar is the range that accuracy must take, for any share of sweet compounds and allowing ±0.005 for rounding: 0.955 to 0.975. The dashed blue line marks the weaker bound that still holds if accuracy, sensitivity and specificity are each averaged over the 10 folds: accuracy ≥ 0.920. The printed 0.88 is outside both.
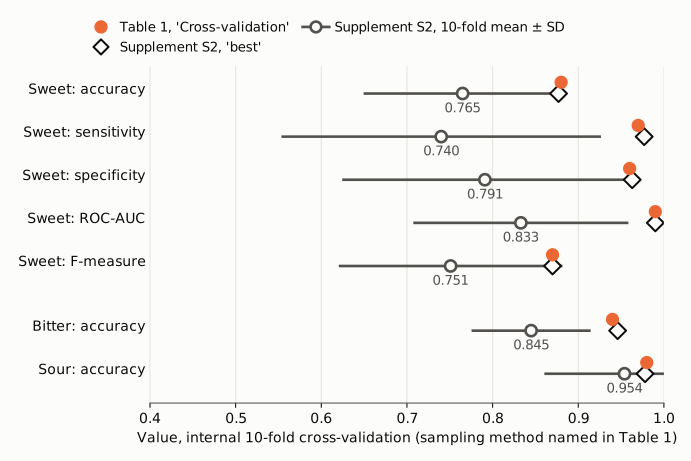
Figure 2. Internal 10-fold cross-validation for the three models, using the sampling method named in Table 1. Orange points are Table 1's "Cross-validation" entries. Open diamonds are the values supplementary file S2 labels "best". Open grey circles with bars are the S2 10-fold mean ± SD (the VirtualSour bar is cut at 1.0). Every Table 1 entry sits at the S2 "best" value, not at the mean. For VirtualSweet the means (accuracy 0.765, sensitivity 0.740, specificity 0.791, AUC 0.833, F-measure 0.751) are 0.115 to 0.230 below the printed values.
Why it matters
- A results table contains an impossible combination. As printed, the VirtualSweet cross-validation row cannot be a single set of results. A reader cannot tell from the article which of accuracy, sensitivity or specificity to trust. The supplement answers this: none of them is the cross-validation average.
- Cross-validation performance is overstated relative to the paper's own supplement. Table 1 and the text present the best value of each metric, picked separately, as the "10-fold cross-validation" result. The S2 averages are lower for all five VirtualSweet and all five VirtualBitter metrics, and for VirtualSour accuracy and F-measure: accuracy 0.765 instead of 0.88 (VirtualSweet), 0.845 instead of 0.94 (VirtualBitter) and 0.954 instead of 0.98 (VirtualSour). VirtualSour sensitivity and specificity are essentially unchanged. A best-of-ten value, picked for each metric separately, is an optimistic summary of a cross-validation run, and the VirtualSweet folds vary widely (accuracy SD 0.114).
- Summary statements rest on these numbers. "88% and above on both, cross-validation and external validation" (Methods and Conclusions) does not hold for the S2 cross-validation means of VirtualSweet (0.765) and VirtualBitter (0.845). Nor does "The specificity and sensitivity ... are balanced and scored 90% and above" for VirtualSweet sensitivity and specificity (0.740 and 0.791) or VirtualBitter specificity (0.792). The abstract's "overall accuracy of 90% and an AUC of 0.98 in 10-fold cross-validation and in an independent test set" compares with S2 cross-validation means across the three models of 0.855 for accuracy and 0.914 for AUC. The article does not say how its 90% and 0.98 were computed; the six Table 1 accuracies average 0.927 and the six AUCs 0.972.
- What is not affected. The external-validation results, which match S2 and are internally consistent for all three models, are the better guide to how the server performs on new compounds: accuracy 0.89, 0.90 and 0.97 for sweet, bitter and sour. The web server itself, the paper's main contribution, is unaffected. The finding concerns how internal-validation performance is reported.
Explanations considered
- Rounding. Does not explain it. Sensitivity of at least 0.965 and specificity of at least 0.955 force accuracy to at least 0.955. The printed 0.88 stands for at most 0.885.
- Class imbalance or SMOTETC oversampling. Does not explain it. Accuracy, sensitivity and specificity from one confusion matrix satisfy accuracy = p × sensitivity + (1 − p) × specificity for every share p. Oversampling changes p, not the identity. Solving for p gives −8.
- Metrics averaged over the 10 folds instead of pooled. Does not explain it. Each fold has accuracy ≥ sensitivity + specificity − 1, so the mean accuracy is at least 0.920. The supplement's actual fold means (0.765, 0.740, 0.791) are consistent with each other, but they are not the values in Table 1.
- Balanced accuracy or another definition of accuracy. Does not explain it. The Methods define accuracy as the share of all actives and inactives predicted correctly. Balanced accuracy would be 0.965.
- A typo in the single cell 0.88. Unlikely. The 88% appears three times in the text, the F-measure of 0.87 sits near it, and S2 gives "best" accuracy 0.877. The cell is a faithful copy of S2. What makes the row impossible is that its entries were taken from different folds.
- The Table 1 values are labelled correctly and S2 is a different analysis. Not supported. The sampling methods match, the external values agree to within 0.01 in 14 of 15 cells, and all 15 cross-validation cells but two match an S2 "best" value. The Methods refer the reader to the supplementary data for the "standard deviation and average".
- A conversion or typesetting artifact. Ruled out. The publisher's page, the PMC page and the PMC archive give the same values, and the 88% also appears in the prose.
- Separate inconsistencies, not part of the main finding. (1) The VirtualSweet text gives cross-validation and external AUC as 0.95 and 0.99, while Table 1 and S2 give 0.99 (best fold) and 0.95. (2) VirtualBitter specificity reads 0.92 for cross-validation and 0.97 for external validation in Table 1, while S2 gives a cross-validation best of 0.973 and an external value of 0.919, which looks like a swap of the two cells. (3) VirtualSour cross-validation AUC is 0.97 in Table 1 and in the text, while S2 gives a mean of 0.996 and a best of 0.998.
Status
- Version of record. The publisher's page (https://doi.org/10.1093/nar/gkab292, resolving to academic.oup.com/nar/article/49/W1/W679/6255693) shows the same Table 1 values, the same "88% on 10-fold cross-validation" sentence and the same AUC wording as the PMC page and the PMC archive. Every quotation from the article was checked verbatim against the PMC-archived text with
src/show.py. - Supplements. The supplementary archive
gkab292_supplemental_files.zip(retrieved through the Europe PMC supplementary-files endpoint) containsS2.xlsxandsupplementary_data(S1).docx. S1 gives the data-set sizes (VirtualSweet 1608 training, 403 test) and a comparison with other servers. S2 gives the internal 10-fold results as "mean+/-SD | best:x" for every sampling method, and single external values. The S2 values used here are transcribed intorecompute.py.txtand were checked cell by cell against the spreadsheet (25 rows, no mismatch). S2 resolves where the impossible row comes from, as described above. - Corrections and comments. As of 2026-10-24 I found no correction, erratum, retraction or expression of concern.
src/known.pyreturns no Crossref update relations and no PMC or Europe PMC notices. The Crossref record has no update-to or updated-by entries. The PubMed record (PMID 33905509) has no CommentsCorrections entries, and a PubMed search for the title with "erratum" or "correction" returned no hits. Neither the publisher's page nor the PMC page shows a notice. A Retraction Watch site search and a web search found nothing. Two checks could not be completed: the Europe PMC REST search returned HTTP 503 on repeated attempts, and PubPeer refused automated access (HTTP 403), so the absence of a PubPeer thread is not confirmed. - Sources. PMC article PMC8262722; publisher's page at doi:10.1093/nar/gkab292; supplementary files S1 and S2 (Europe PMC); Crossref; PubMed; Retraction Watch; PubPeer (not reachable).
Suggested correction
In Table 1, either (a) replace the cross-validation rows with the 10-fold mean ± SD from S2. For VirtualSweet that is accuracy 0.77 ± 0.11, sensitivity 0.74 ± 0.19, specificity 0.79 ± 0.17, ROC-AUC 0.83 ± 0.12 and F-measure 0.75 ± 0.13. For VirtualBitter it is 0.85, 0.90, 0.79, 0.91 and 0.86; for VirtualSour 0.95, 0.94, 0.97, 1.00 (0.996) and 0.94. Or (b) keep the current values but relabel the rows as the best single-fold value of each metric, chosen separately, and state that the values in one column do not come from the same fold. Option (a) gives the conventional cross-validation estimate.
Correspondingly, in the VirtualSweet subsection, replace "a prediction accuracy of 88% on 10-fold cross-validation" with the mean (77%), and correct "The AUC–ROC values of cross-validation and external validation are 0.95 and 0.99, respectively" to the Table 1/S2 values (cross-validation 0.83 as a mean, or 0.99 as the best fold; external 0.95). Revise the "88% and above" and "balanced and scored 90% and above" sentences in the Methods and Conclusions, and the abstract's "overall accuracy of 90% and an AUC of 0.98 in 10-fold cross-validation", to match whichever summary is adopted. The authors may also wish to check the VirtualBitter specificity cells (Table 1: 0.92 cross-validation, 0.97 external; S2: 0.973 best, 0.919 external) and the VirtualSour cross-validation AUC (Table 1 and text 0.97; S2 0.996 mean, 0.998 best).