← Back to the plain-language case
Abstract states a 60-fold affinity difference; the paper's reported dissociation constants imply about 2-fold
eLife (2021) · doi:10.7554/eLife.48840 · PMC8257255
Summary
The abstract says that FasL binds DR5 with an affinity "approximately 60-fold lower than the affinity between TRAIL and DR5". The only affinity values in the paper are two surface plasmon resonance (SPR) dissociation constants in the Results: KD = 1.23 × 10⁻¹² M for DR5–FasL and 6.01 × 10⁻¹³ M for DR5–TRAIL. Their ratio is 2.05, so the paper's own numbers support a roughly 2-fold difference, 29 times smaller than the abstract states. No simple slip in either number gives 60, and nothing in the deposited SPR source data gives 60 either. The abstract is where most readers learn how strong the newly proposed FasL–DR5 interaction is, so the stated magnitude matters. The direction of the comparison (FasL binds more weakly than TRAIL) is the same in both places.
What the paper reports
The PMC text flattens superscripts ("10-12"). Below they are written as superscripts, as in the eLife version of record and the Europe PMC JATS markup. The wording is otherwise verbatim.
Abstract:
Subsequent cellular and biochemical analyses revealed that DR5 interacted specifically with recombinant FasL–Fc protein, although the strength of this interaction was approximately 60-fold lower than the affinity between TRAIL and DR5.
Results, section "DR5 is a Fas-independent receptor for sFasL that promotes arthritis":
Furthermore, specific binding of DR5 to FasL was confirmed by surface plasmon resonance (KD: 1.23 × 10⁻¹² M for DR5–FasL versus 6.01 × 10⁻¹³ M for DR5–TRAIL; Figure 1—figure supplement 4F,G)
Legend of Figure 1—figure supplement 4:
(F, G) Surface plasmon resonance assays for DR5–FasL (F) and DR5–TRAIL (G) interactions.
Materials and methods, "Surface Plasmon resonance":
To determine equilibrium affinity measurements, recombinant DR5 (R and D systems: 631-T2-100) was coupled with a CM5 sensor chip using 10 mM sodium acetate (pH 5.5), and recombinant FasL or TRAIL (R and D Systems: 126-FL-010) was passed over the chip at a flow rate of 30 μL/min for 120 s.
BIA evaluation software version 3.1 (GE Healthcare) was used for to analyze the data.
No other KD, affinity constant or fold-difference in affinity appears anywhere in the article text, figure legends or tables.
What the paper's own numbers show
Method. A lower affinity means a larger KD, so the fold by which FasL–DR5 affinity is lower than TRAIL–DR5 affinity is KD(FasL) / KD(TRAIL). I computed this ratio from the two printed values, allowed for rounding of their last digit, and worked out what either KD would have to be for the ratio to be 60. I then checked whether a single slip in a mantissa or exponent could turn the printed values into a 60-fold ratio. Finally I set the printed KDs against the analyte concentrations listed in the eLife source data for panels 4F and 4G. Every number below is printed by recompute.py.txt.
| Quantity | Location | Reported | Recomputed from the paper's own numbers |
|---|---|---|---|
| KD, DR5–FasL | Results; Fig. 1—fig. suppl. 4F | 1.23 × 10⁻¹² M | (input) |
| KD, DR5–TRAIL | Results; Fig. 1—fig. suppl. 4G | 6.01 × 10⁻¹³ M | (input) |
| Fold lower affinity, FasL vs TRAIL | Abstract | approximately 60-fold | 2.05 (1.23 × 10⁻¹² / 6.01 × 10−13 = 2.0466; 2.037 to 2.057 allowing for rounding) |
| Abstract value ÷ implied value | derived | — | 60 / 2.0466 = 29.3 |
| KD(FasL) that a 60-fold ratio would need, if KD(TRAIL) is as printed | derived | — | 3.61 × 10⁻¹¹ M (29.3 × the printed value) |
| KD(TRAIL) that a 60-fold ratio would need, if KD(FasL) is as printed | derived | — | 2.05 × 10⁻¹⁴ M (29.3 × below the printed value) |
| Ratios under single-digit or single-exponent slips | derived | — | 0.205, 10, 20.5 or 205; none near 60 |
| Analyte concentrations injected | Figure 1 source data 1, panels 4F and 4G | FasL 125, 250, 500, 1000 nM; TRAIL 15.625 to 250 nM | lowest concentration ÷ printed KD: 1.0 × 10⁵ (FasL), 2.6 × 10⁴ (TRAIL) |
The two printed constants share the same unit (M), so the ratio is dimensionless and does not depend on unit conventions. It also does not depend on whether one speaks of "affinity" as 1/KD: the TRAIL-to-FasL affinity ratio is still 2.05, and FasL's affinity is 0.489 times TRAIL's. To reach 60 one of the two constants would have to be about 29 times different from its printed value, and no change of one digit or one power of ten in either does that.
Figure
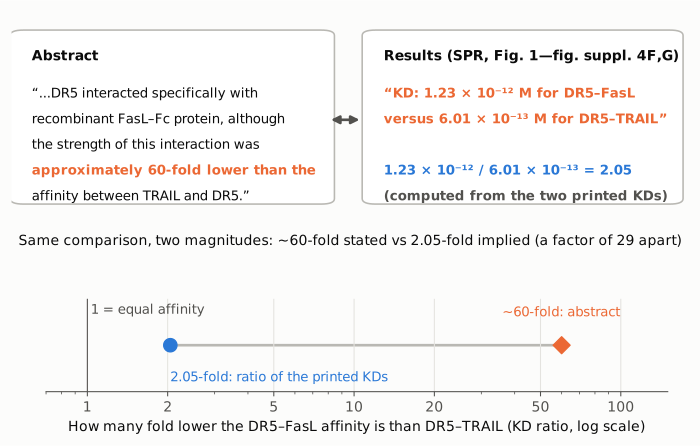
Figure 1. Top: the two passages that make the same comparison. Orange text marks values as printed in the paper; blue marks the ratio computed from them. Bottom: the same comparison on a log fold axis, with the thin line at 1 for equal affinity. The ratio of the printed KDs is 2.05 (blue circle). The abstract states approximately 60 (orange diamond). The two differ by a factor of 29. A log axis is used because the quantity is a ratio; it shows the distance between the two values at its true proportion.
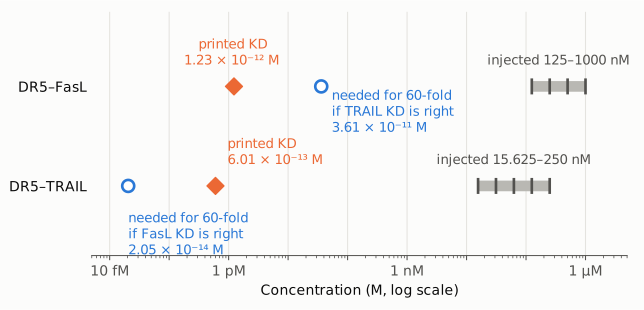
Figure 2. Concentration on a log axis. Orange diamonds: the KDs printed in the Results. Blue open circles: the KD each interaction would need for the abstract's 60-fold figure to hold if the other KD is as printed (3.61 × 10⁻¹¹ M for FasL; 2.05 × 10⁻¹⁴ M for TRAIL). Grey bars with tick marks: the analyte concentrations injected, taken from the eLife source data for Figure 1—figure supplement 4F and 4G. A 60-fold difference would need one constant to move by a factor of 29. The figure also shows that both printed KDs lie four to five orders of magnitude below the lowest concentration injected. This bears on how well the KDs are determined (see Explanations considered).
Why it matters
- A headline characterization of the paper's central new interaction is not supported by its own numbers. The abstract gives readers one quantitative statement about how strongly FasL binds its proposed new receptor, and that statement is 29 times larger than the ratio of the constants the paper reports. A reader of the abstract would conclude that FasL is a much weaker DR5 ligand than TRAIL. A reader of the Results would conclude that the two bind DR5 about equally well (a 2-fold difference, both in the picomolar range).
- The magnitude bears on interpretation. Whether sFasL can act on DR5 at the concentrations present in inflamed joints, and whether TRAIL would compete with it, depends on how much weaker FasL binds. The Discussion notes that "differences in CX3CL1 production may be attributable to differences in binding affinity". A 60-fold and a 2-fold difference support different readings of that sentence.
- What is not affected. The direction of the comparison is the same in the abstract and the Results. The flow-cytometry, knockdown, knockout, immunoprecipitation and in vivo arthritis experiments do not use either KD, and their conclusions do not depend on the size of the affinity difference.
- Reach. Crossref lists 16 citing works as of 2026-10-24.
Explanations considered
- Direction or definition of "affinity". Does not account for it. Lower affinity means larger KD, and the FasL KD is indeed the larger one, so the abstract's direction is right. Whether one divides KDs or affinities (1/KD), the magnitude is 2.05, not 60.
- Unit mismatch. Ruled out. Both constants are printed in M in one sentence.
- A typographical slip in one constant. Not able to explain it. Changing one exponent by one gives 20.5 or 205, the mantissa ratio alone is 0.205, and the exponent difference alone is 10. A 60-fold ratio would need KD(FasL) ≈ 3.61 × 10⁻¹¹ M or KD(TRAIL) ≈ 2.05 × 10⁻¹⁴ M, neither of which is one keystroke from the printed values.
- A conversion or rendering artifact. Ruled out. The eLife version of record prints "1.23 × 10⁻¹² M" and "6.01 × 10⁻¹³ M" with superscript exponents and true minus signs. The Europe PMC JATS XML has the same markup. The PMC display "10-12" is only flattened superscripts.
- The 60-fold figure comes from a different comparison. Possible, but it does not rescue the sentence as published. In the eLife peer-review record (decision letter and author response, published with the article), the editor suggested abstract wording "along the lines of" the following: "Subsequent cellular and biochemical analysis revealed that DR5 can specifically interact with recombinant FasL-Fc protein, albeit with an approximately 60-fold lower affinity than Fas." The revised abstract in the author response changed the comparator: "albeit with an approximately 60-fold lower affinity than interaction between TRAIL and DR5." The number stayed at 60 while the comparator changed from Fas to TRAIL–DR5. The paper reports no FasL–Fas affinity, and no KD appears anywhere in the review record. So a FasL–Fas comparison cannot be checked from the paper, and the printed sentence ties 60-fold to TRAIL–DR5, for which the paper's constants give 2.05.
- A different quantity from the SPR data. Checked; none gives about 60. In the eLife source data for panels 4F and 4G, a global 1:1 binding model fitted to the software-fitted sensorgrams gives association rate constants ka ≈ 7.4 × 10³ M−1s−1 for FasL and ≈ 7.3 × 10⁴ M−1s−1 for TRAIL, a ratio of 9.8. (The FasL fit reproduces those curves to 0.00025 RU; the TRAIL fit is approximate, with a residual of 60 RU on a 2557 RU signal.) The peak responses at equal concentrations differ by factors of 2722 (125 nM) and 1390 (250 nM). The geometric-mean ratio of the injected concentrations is 5.66.
- The printed KDs themselves are imprecise. This is a separate observation. It does not explain the discrepancy, but it bears on how to correct it. Both printed KDs lie 2.6 × 10⁴ to 1.0 × 10⁵ times below the lowest concentration injected. At such concentrations the surface is effectively saturated at equilibrium (predicted occupancy at least 0.99996), so the equilibrium responses carry no information on KD. A picomolar KD would then rest on the dissociation rate. In the software-fitted curves of the source data, the dissociation phase is flat: the response at the end of dissociation is 1.00000 of its starting value for FasL over 240 s and 0.99993 to 0.99998 for TRAIL over 360 s. For FasL, fixing the dissociation rate anywhere from 10−12 to 10−6 s−1 fits those curves equally well (rms 0.00025 to 0.00026 RU), which corresponds to KD values from 1.3 × 10⁻¹⁶ to 1.3 × 10⁻¹⁰ M. The printed FasL KD together with the fitted ka implies kd ≈ 9.1 × 10⁻⁹ s−1, or about 2 × 10⁻⁶ of the bound complex dissociating during the 240 s window. The deposited data are therefore consistent with the printed FasL KD but do not determine it, and the same appears to hold for TRAIL. So the 2.05 ratio is what the paper reports, not necessarily the true affinity ratio. A smaller discrepancy: the Methods give a 120 s injection for both analytes, while the TRAIL sensorgrams in the source data peak at 100 s.
- A correction already issued. None found (see Status).
Status
- Version of record. The eLife version of record (elifesciences.org/articles/48840, Version of Record dated 5 July 2021) has the same abstract sentence and the same KD values as the PMC archive and the Europe PMC full-text XML. Every quotation from the article was checked verbatim against the PMC-archived text with
src/show.py. The peer-review quotations were checked against the decision letter and author response in the Europe PMC XML (sub-articles sa1 and sa2). - Supplements. Figure 1 source data 1 (
elife-48840-fig1-data1-v1.xlsx, cdn.elifesciences.org), sheet "Figure 1 - figure supplement 4", holds the raw and fitted sensorgrams for panels 4F (sFasL, 125 to 1000 nM) and 4G (TRAIL, 15.625 to 250 nM). It contains no KD table and no fold-difference.recompute.py.txtreads it (section 4) and prints every source-data number used above. Nothing in it reconciles 60-fold with the printed constants. - Corrections and comments. As of 2026-10-24 I found no correction, erratum, retraction or expression of concern.
src/known.pyreturns no Crossref update relations, no PMC notices and no Europe PMC notices. The Crossref record has empty update-to and updated-by fields; its relations list only the GEO dataset GSE110343 and the two peer-review documents. The eLife article page shows no correction notice. The PubPeer API returned no record (HTTP 404) for the DOI, and a web search for the title together with "PubPeer" found no thread. - Sources. PMC article PMC8257255; eLife version of record https://elifesciences.org/articles/48840 and its peer-review record; Europe PMC full-text XML; Figure 1 source data 1; Crossref; Europe PMC; PubPeer; https://doi.org/10.7554/eLife.48840.
Suggested correction
The authors should say which measurement supports the abstract's fold-difference, then make the abstract and the Results agree. If the SPR constants in the Results are the intended basis, the abstract sentence could read:
Subsequent cellular and biochemical analyses revealed that DR5 interacted specifically with recombinant FasL–Fc protein, although the strength of this interaction was approximately 2-fold lower than the affinity between TRAIL and DR5.
If the 60-fold figure comes from another measurement or comparison (for example FasL–Fas, as in the wording suggested during review), that measurement and its value should be reported in the Results and the abstract's comparator corrected to match. Because the deposited sensorgrams show essentially no dissociation and the printed picomolar KDs lie 104 to 105 times below the lowest concentration injected, the authors may also wish to report ka, kd and their uncertainties, or the range of KD that the data can support. They may also wish to correct the injection time given in the Methods for TRAIL (100 s in the source data, 120 s in the text).