← Back to the plain-language case
Table 3's COVID-19 death risks of 0.10% and 0.30% do not match the paper's event counts
Ann Rheum Dis (2021) · doi:10.1136/annrheumdis-2021-219845 · PMC8206171
Summary
The abstract, Results, Table 3 and Discussion give the risk of death from COVID-19 among all 110,567 patients with inflammatory joint disease (IJD) as 0.10%, against 0.07% in matched referents, a crude excess of 0.03 per 100 persons. The paper defines risk as events divided by individuals at risk on 1 March 2020, and Table 3 gives 161 COVID-19 deaths, so the risk is 161/110,567 = 0.146%. The crude excess is then 0.076 per 100 (about 7.6 per 10,000), not 0.03 (3 per 10,000), and the crude risk ratio from the counts (2.09) equals the paper's unadjusted hazard ratio. The rheumatoid arthritis (RA) row has a similar mismatch, 134/53,455 = 0.251% against a printed 0.30%. All 28 other risk cells in Table 3 match events divided by cohort size. The understated figures feed the abstract and the Discussion's patient-counselling statements. The hazard ratios and the qualitative conclusion that absolute risks are low are not affected.
What the paper reports
All quotations were checked verbatim against the PMC-archived text.
Abstract, Results:
Among patients with IJD, the risks of hospitalisation (0.5% vs 0.3% in their population referents), admission to intensive care (0.04% vs 0.03%) and death (0.10% vs 0.07%) due to COVID-19 were low.
Methods, Statistics (definition of risk):
In each cohort, we next calculated absolute risks for hospitalisation, admission to intensive care and death due to COVID-19, defined as the ratio of the number of incident events 1 March through 1 September 2020 and the number of individuals at risk in each cohort 1 March 2020. We calculated excess risks (IJD vs the general population) as the difference in risk between the IJD and its population comparator cohort, and relative risks via unadjusted and adjusted Cox models as described above.
Table 1, cohort sizes (columns RA, other IJD, all IJDs combined, matched general population referents):
Individuals* | 53 455 | 57 112 | 110 567 | 484 277
Table 3, columns: outcome | N events (risk, %) in the IJD cohort | N events (risk, %) in the general population | crude excess risk per 100 patients | HR model 1 | HR model 2. The "All" block:
Death, COVID-19 | 161 (0.10%) | 338 (0.07%) | 0.03 | 2.09 (1.73 to 2.52) | 1.18 (0.97 to 1.44)
Table 3, "RA" block:
Death, COVID-19 | 134 (0.30%) | 245 (0.11%) | 0.19 | 2.28 (1.85 to 2.81) | 1.27 (1.02 to 1.59)
Table 3, "Other IJD" block:
Death, COVID-19 | 27 (0.05%) | 93 (0.04%) | 0.01 | 1.34 (0.87 to 2.05) | 0.83 (0.54 to 1.28)
Table 3 footnote for the excess-risk column:
*Defined as the difference between the risk in the inflammatory joint disease cohort and that in its matched population comparator cohort.
Results, subsection on risks, excess risks and relative risks for COVID-19-related and other outcomes:
Among all individuals with IJD, the risk for hospitalisation because of COVID-19 during March through September 2020 was 0.5% (vs 0.3% in their general population referents), 0.04% (vs 0.03%) for admission to ICD due to COVID-19 and 0.10% (vs 0.07%) for death from COVID-19.
Discussion, first paragraph, principal finding (3):
(3) In absolute terms, the risks for admission to hospital due to COVID-19 (0.5%, an additional 0.2 per 100 persons compared with the general population), to intensive care due to COVID-19 (0.04%, an additional 0.01 per 100 persons) and for death due to COVID-19 (0.10%, an additional 0.03 per 100 persons) among patients with IJDs were low.
Discussion, third paragraph:
Our results have important implications for patient counselling in that they suggest that (1) The absolute risk of death from COVID-19 among individuals with IJD between March and September was in the order of 1 in a 1000, (2) The additional risk in individuals with IJD compared with the general population was in the order of 3 per 10000
What the paper's own numbers show
Method. I applied the paper's stated definition (events ÷ individuals at risk on 1 March 2020) to every cell of Table 3, using the cohort sizes in Table 1, and checked whether each computed risk falls inside the interval that rounds to the printed value. I then recomputed the crude excess (the difference in risks) and the crude risk ratio, and compared the ratio with the unadjusted Cox HR (model 1). Over six months with risks below 10%, the crude risk ratio and the unadjusted HR should be close. The paper does not print the sizes of the RA and other-IJD referent cohorts. I bounded them from the referent cells of Table 3, which together give 220,724 to 223,453 for RA, and used the midpoint, 222,089. No RA conclusion below depends on where in that range the value lies. Every number below is printed by recompute.py.txt.
| Quantity | Location | Reported | Recomputed from the paper's own numbers |
|---|---|---|---|
| Subgroup COVID-19 deaths, IJD | Table 3 | 134 (RA) + 27 (other IJD); 161 (all) | 134 + 27 = 161; cohort sizes 53,455 + 57,112 = 110,567 |
| Risk of COVID-19 death, all IJDs | Table 3; Abstract; Results; Discussion | 0.10% | 0.146% (161/110,567); 0.10% would require 106 to 116 deaths |
| Risk of COVID-19 death, referents | Table 3; Abstract; Results | 0.07% | 0.070% (338/484,277), consistent |
| Crude excess risk, all IJDs | Table 3; Discussion | 0.03 per 100 ("3 per 10000") | 0.076 per 100 (7.58 per 10,000) |
| Absolute risk, all IJDs, per 1000 | Discussion ("1 in a 1000") | about 1 | 1.46 |
| Crude risk ratio, all IJDs | implied by Table 3 | 0.10/0.07 = 1.43 from the printed percentages | 2.09 from the counts; HR model 1 is 2.09 |
| Risk of COVID-19 death, RA | Table 3 | 0.30% | 0.251% (134/53,455); 0.30% would require 158 to 163 deaths |
| Risk of COVID-19 death, RA referents | Table 3 | 0.11% | 0.110% (245/222,089; 0.1096 to 0.1110 across the bounded range), consistent |
| Crude excess risk, RA | Table 3 | 0.19 per 100 | 0.140 per 100 (0.1397 to 0.1410) |
| Crude risk ratio, RA | implied by Table 3 | 0.30/0.11 = 2.73 from the printed percentages | 2.27 from the counts; HR model 1 is 2.28 |
| Risk of COVID-19 death, other IJD | Table 3 | 0.05% | 0.047% (27/57,112), consistent |
| The other 13 IJD-cohort risks | Table 3 | e.g. 8.1%, 0.5%, 0.04%, 1.2%, 9.9%, 0.7% | e.g. 8.114%, 0.525%, 0.041%, 1.185%, 9.868%, 0.709%: all inside their rounding intervals |
| Crude risk ratio vs HR model 1, other 13 rows | Table 3 | HR 0.78 to 2.02 | crude ratios within 0.03 of the HR in every row |
Every other risk cell in Table 3, 13 in the IJD columns and 15 in the referent columns, matches events ÷ cohort size at its printed precision. Every crude risk ratio computed from the counts is within 0.03 of the tabulated HR model 1, the two COVID-19 death rows included. The two COVID-19 death percentages, 0.10% for all IJDs and 0.30% for RA, are the only cells that disagree with their own counts. In both cases the printed excess equals the difference of the printed percentages (0.10 − 0.07 = 0.03 and 0.30 − 0.11 = 0.19), so the excess column carries the discrepancy forward.
Figure
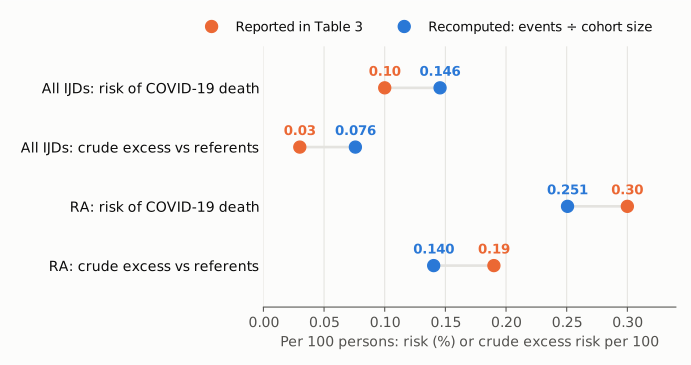
Figure 1. COVID-19 death, 1 March to 1 September 2020, per 100 persons, on a linear axis starting at zero. Orange dots are the values printed in Table 3 (all IJDs: risk 0.10%, crude excess 0.03 per 100; RA: risk 0.30%, crude excess 0.19 per 100). Blue dots are the values recomputed from the same table's event counts and Table 1's cohort sizes, using the paper's definition of risk (all IJDs: 0.146% and 0.076; RA: 0.251% and 0.140, with the RA referent denominator bounded from Table 3 as described above). For all IJDs, the printed excess is about 2.5 times smaller than the recomputed one. For RA, the printed values are higher than the recomputed ones.
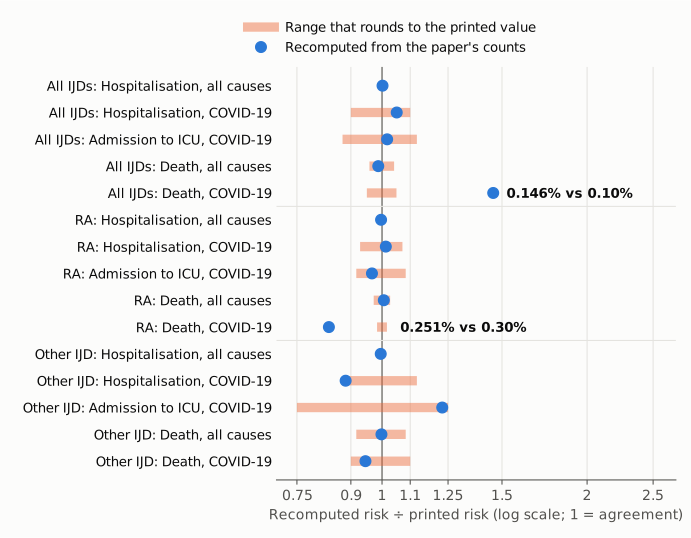
Figure 2. Each IJD-cohort risk in Table 3, shown as the recomputed risk (events ÷ cohort size) divided by the printed risk, on a log scale where 1 means exact agreement. The orange band in each row is the range of risks that round to the printed value, on the same ratio scale; it is wide for values printed to one significant figure (e.g. 0.02%) and narrow for values such as 8.1%. Blue dots inside their band are consistent with rounding. Thirteen of the 15 rows are consistent. The all-IJD COVID-19 death cell (0.146% vs printed 0.10%, ratio 1.46) and the RA COVID-19 death cell (0.251% vs printed 0.30%, ratio 0.84) are not.
Why it matters
- A headline absolute risk is understated. The abstract's only figure for COVID-19 mortality in IJD is "0.10% vs 0.07%". By the paper's own definition and counts the IJD figure is 0.15%, about 1.5 times the printed value.
- The excess risk used for patient counselling is understated about 2.5-fold. The Discussion states that the additional risk "was in the order of 3 per 10000" and the absolute risk "in the order of 1 in a 1000". The counts give about 7.6 per 10,000 and about 1.5 per 1000. The paper presents these two numbers as implications for patient counselling, so the understatement reaches the advice that the paper suggests clinicians give.
- The RA row has the reverse problem. For RA the printed risk (0.30%) and crude excess (0.19 per 100) are higher than the counts give (0.25% and 0.14 per 100).
- What is not affected. The direction of every comparison stays the same. The Cox hazard ratios (2.09 and 1.18 for all IJDs; 2.28 and 1.27 for RA) and their confidence intervals agree with the counts, as the crude ratios show, and are not changed by this finding. So are the statements about statistical precision, the all-cause mortality and hospitalisation results, and the drug-specific analyses. The conclusion that absolute and excess risks of COVID-19 death are low holds qualitatively at 0.15% and 0.08 per 100. Only the stated sizes are affected.
Explanations considered
- Rounding. Does not account for it. 0.146% rounds to 0.15% at the precision shown. Only 106 to 116 deaths among 110,567 people would round to 0.10%. For RA, only 158 to 163 deaths among 53,455 would round to 0.30%.
- A different denominator, such as person-time. Does not account for it. The paper defines risk per individual at risk on 1 March 2020, and all 28 other risk cells follow that definition. Dividing by the 55,336 person-years reported for the IJD cohort gives 0.291 per 100 person-years, not 0.10. A risk of 0.10% from 161 deaths would need a denominator of about 153,000 to 169,000, which matches none of the cohort sizes in Table 1 (53,455; 57,112; 110,567; 484,277).
- The count, not the percentage, is the wrong figure. Not supported. The all-IJD count of 161 equals the RA and other-IJD counts added together (134 + 27), and the referent count of 338 equals 245 + 93. The crude risk ratio from the counts (2.086) reproduces HR model 1 (2.09), whereas the printed percentages imply 1.43. The same holds for RA: 2.27 from the counts against an HR of 2.28, and 2.73 from the printed percentages. A count near 111 would be inconsistent with the subgroup counts and with the hazard ratio.
- A cumulative-incidence estimator with censoring (e.g. Kaplan–Meier). Does not account for it. Censoring for emigration or other reasons can only make such an estimate equal to or larger than events ÷ baseline N, never 30% smaller. The paper also states that it used events ÷ individuals at risk.
- A text-conversion artifact. Ruled out. The cells are plain decimals in the publisher-deposited JATS XML, with no superscripts, signs or special characters. The same 0.10% appears in four separate places (abstract, Results text, Table 3 and Discussion), and the PubMed abstract reads the same.
- Supplementary material with a different basis. The single supplementary file has no alternative denominator or outcome table for COVID-19 death in the whole IJD cohort (see Status).
- A possible source of the RA figure (observation only). The printed RA risk, 0.30%, equals the all-IJD death count over the RA denominator (161/53,455 = 0.301%). This could reflect a cell-level mix-up, but the published material cannot confirm it. It does not explain the all-IJD figure of 0.10%.
Status
- Version of record. The publisher's site (ard.bmj.com, reached through doi.org) returned a Cloudflare challenge (HTTP 403) to automated requests for the HTML and for the PDFs, both the early-access PDFs and 80/8/1086.full.pdf. I checked the publisher-deposited JATS XML in Europe PMC, the live PMC page and the PubMed abstract (PMID 33622688). All three agree with every passage quoted here. Table 3 is encoded as a real table, not an image. Every quotation was checked verbatim against the PMC-archived text.
- Supplements. The single supplementary file,
annrheumdis-2021-219845supp001.pdf(27 pages, from the Europe PMC supplementary bundle), was read in full. It covers a sulfasalazine post hoc analysis, data sources and ICD-10/ATC codes, cohort characteristics for 2015–2019, covariates, DMARD cohort characteristics, standardised mean differences and daily COVID-19 deaths in Sweden. It has no outcome table, denominator or person-time basis that would account for the 0.10% or 0.30% figures. - Corrections and comments. As of 2026-10-24 I found no correction, erratum, retraction or expression of concern.
src/known.pyreturns no Crossref update relations, no PMC notices and no Europe PMC notices. The Crossref record has no update-to or updated-by entries and an empty relation field, and the PMC page has no correction banner. PubMed lists one CommentsCorrections entry, "CommentIn: Ann Rheum Dis 2023;82(11):e223" (doi:10.1136/annrheumdis-2021-220938). Its title refers to a different article (the TICOSPA trial in axial spondyloarthritis), and it is not a correction notice. The PubPeer API returned no record (HTTP 404) for the DOI, and a web search for the title with "PubPeer", "erratum" or "correction" found no thread or notice for this article. The only correction it found belongs to a related paper in RMD Open, concerns author-name spelling and has no bearing on these figures. - Sources. PMC article PMC8206171; Europe PMC full-text XML and supplementary files for PMC8206171; PubMed records 33622688 and 34226191; Crossref records for 10.1136/annrheumdis-2021-219845 and 10.1136/annrheumdis-2021-220938; PubPeer; https://doi.org/10.1136/annrheumdis-2021-219845.
Suggested correction
If the counts are correct, as the subgroup sums and hazard ratios indicate, the following changes would make the text agree with the paper's own definition and data.
- Table 3, "All" block, COVID-19 death row: change "161 (0.10%) | 338 (0.07%) | 0.03" to "161 (0.15%) | 338 (0.07%) | 0.08".
- Table 3, "RA" block, COVID-19 death row: change "134 (0.30%) | 245 (0.11%) | 0.19" to "134 (0.25%) | 245 (0.11%) | 0.14". The authors can confirm the excess from the exact size of the RA referent cohort; the bounded range gives 0.14 throughout.
- Abstract: "death (0.10% vs 0.07%)" becomes "death (0.15% vs 0.07%)".
- Results: "0.10% (vs 0.07%) for death from COVID-19" becomes "0.15% (vs 0.07%) for death from COVID-19".
- Discussion, finding (3): "(0.10%, an additional 0.03 per 100 persons)" becomes "(0.15%, an additional 0.08 per 100 persons)".
- Discussion, patient-counselling paragraph: "in the order of 1 in a 1000" becomes "in the order of 1.5 in 1000", and "in the order of 3 per 10000" becomes "in the order of 8 per 10000".
If the event counts are instead the erroneous figures, the counts, subgroup counts and hazard ratios would all need to be corrected together, since they are mutually consistent as printed.