← Back to the plain-language case
Abstract reports a diastolic blood pressure difference that the trial's own analyses do not show
JAMA Network Open (2021) · doi:10.1001/jamanetworkopen.2021.12417 · PMC8176331
Summary
This randomized trial of a smartphone lifestyle app (204 adults with type 2 diabetes in Singapore) lists diastolic blood pressure in its abstract among the outcomes with "intergroup differences favoring the intervention". The paper's Table 2 gives the diastolic between-group differences as −2.6 mm Hg (95% CI −6.2 to 0.9; P = .15) at 3 months and −2.4 mm Hg (95% CI −5.7 to 1.0; P = .17) at 6 months, and the complete-case analysis in Supplement 1 gives P = .13 and .08. All four intervals include zero, recomputation from the printed means and SDs agrees with them, and the paper's own Results text says that between-group differences in blood pressure were not observed at 6 months. The primary outcome (weight) and the glycemic results are unaffected, but the abstract credits the app with a blood pressure benefit that none of the paper's reported analyses supports at its stated threshold of 2-sided P < .05.
What the paper reports
Abstract, Results (the sentence follows the 6-month weight, HbA1c and medication results):
Intergroup differences favoring the intervention were also noted for fasting blood glucose, diastolic blood pressure, and dietary changes.
Results, "Metabolic Outcomes":
Between-group differences in blood pressure and lipids were not observed at 6 months.
Table 2, "Change in diastolic blood pressure, mm Hg" (blood pressure block: control group, 72 participants; intervention group, 67 participants). Columns: participants, control mean (SD) change, intervention mean (SD) change, mean difference (95% CI), P value, Cohen d. Superscript b is reproduced as "b":
3 mo | 139 | -1.8 (11.0) | -4.4 (9.9)b | -2.6 (-6.2 to 0.9) | .15 | 0.25
6 mo | 139 | -3.1 (9.2)b | -5.4 (11.1)b | -2.4 (-5.7 to 1.0) | .17 | 0.23
Table 2, footnote b (it marks within-group change from baseline, not between-group differences):
Statistically significant change from baseline to postintervention at P < .05, after Benjamini-Hochberg correction with false discovery rate at 0.20 and with 76 participants.
Supplement 1, eTable 1 (complete-case analysis), "∆ Diastolic blood pressure (mmHg)", as extracted from the PDF:
3 months 132 -1.6 (10.6) -4.1 (8.8)* -2.6 (-5.9 to 0.8) .13 0.26
6 months 131 -2.5 (7.9)* -5.4 (10.9)* -2.9 (-6.2 to 0.4) .08 0.30
Methods, "Statistical Analysis":
Type I error for multiple comparisons was adjusted using the Benjamini-Hochberg procedure with false discovery rate at 0.20.
Statistical significance was set at 2-sided P < .05.
Results, "Participants":
Baseline characteristics were similar between study groups, except for a significantly higher diastolic blood pressure in the control group.
What the paper's own numbers show
Method. The paper fitted generalized linear mixed models to change from baseline on 5 multiply imputed data sets, with recruitment source as a random effect. That model cannot be refitted from published summaries, so I checked the printed numbers against each other in two ways. (a) From the printed mean (SD) changes and group sizes (72 and 67 for blood pressure), I computed the intervention-minus-control difference with a pooled-variance t 95% CI and 2-sided P, a Welch P, and Cohen d. (b) I back-calculated the 2-sided P implied by each printed 95% CI (normal approximation, SE = CI width / 3.92). eTable 1 does not give the group split behind its n = 132 and 131, so its rows assume 66/66 and 66/65; across every split consistent with at most 72 control and 67 intervention participants, the recomputed P ranges only from .142 to .148 (3 mo) and .080 to .085 (6 mo). Every number below is printed by recompute.py.txt.
| Quantity | Location | Reported | Recomputed from the paper's numbers |
|---|---|---|---|
| Diastolic BP difference, 3 mo (multiple imputation) | Table 2 | −2.6 (−6.2 to 0.9); P = .15; d = 0.25 | −2.60 (−6.12 to 0.92); P = .146 (Welch .145; from printed CI .151); d = 0.25 |
| Diastolic BP difference, 6 mo (multiple imputation) | Table 2 | −2.4 (−5.7 to 1.0); P = .17; d = 0.23 | −2.30 from the rounded arm means (−5.71 to 1.11); P = .185 (Welch .188; from printed CI .160); d = 0.23 |
| Diastolic BP difference, 3 mo (complete case) | Supplement 1, eTable 1 | −2.6 (−5.9 to 0.8); P = .13 | −2.50 (−5.85 to 0.85); P = .143 (from printed CI .128) |
| Diastolic BP difference, 6 mo (complete case) | Supplement 1, eTable 1 | −2.9 (−6.2 to 0.4); P = .08 | −2.90 (−6.19 to 0.39); P = .083 (from printed CI .085) |
| One-sided P implied by the printed CIs (not the paper's convention) | Table 2; eTable 1 | — | .076 and .080 (multiple imputation, 3 and 6 mo); .064 and .042 (complete case) |
| Systolic BP difference, 3 mo / 6 mo (for comparison) | Table 2 | −4.2 (−8.8 to 0.3), P = .07 / −2.8 (−7.7 to 2.0), P = .25 | −4.30 (−8.98 to 0.38), P = .072 / −2.80 (−7.66 to 2.06), P = .257 |
| Systolic BP difference, 3 mo (complete case) | Supplement 1, eTable 1 | −4.7 (−9.3 to −0.2); P = .04 | −4.70 (−9.25 to −0.15); P = .043, the only blood pressure comparison in the paper below .05 |
| Fasting blood glucose difference, 6 mo (named in the same abstract sentence) | Table 2 | −12.6 (−23.4 to −3.6); P = .01 | −12.6 (−21.4 to −3.8); P = .005 |
| Calorie intake difference, 6 mo (named in the same abstract sentence, "dietary changes") | Table 2 | −305.8 (−441.0 to −170.7); P < .001 | −305.5 (−441.1 to −169.9); P < .001 |
| Baseline diastolic BP, control vs intervention | Table 1; Results | 85.7 (9.8) vs 82.7 (8.8); "significantly higher" in control | difference 3.0 mm Hg; t = 2.30, P = .023 |
| Participants with blood pressure data | Table 2 | 139 of 204 randomized | 68.1% |
Both multiple-imputation analyses and both complete-case analyses of diastolic blood pressure have 95% CIs that include zero, and recomputation reproduces each printed P value to within rounding. Of the outcomes named in the abstract sentence, fasting blood glucose and the dietary outcomes have between-group P values below .05 in Table 2. Diastolic blood pressure does not, in any analysis the paper reports.
Figure
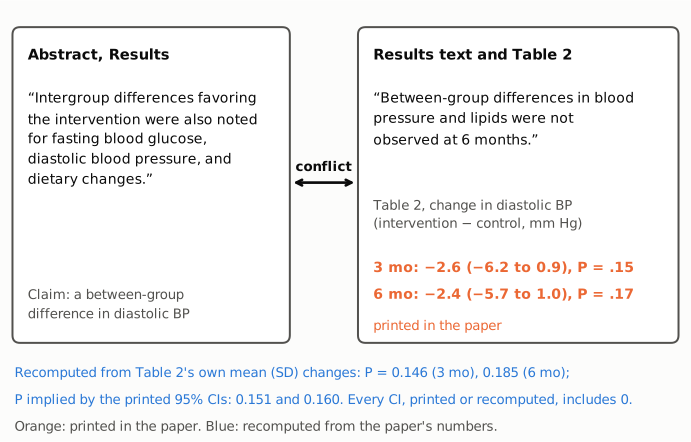
Figure 1. The conflicting statements, quoted from the article. Left: the abstract lists diastolic blood pressure among the outcomes with intergroup differences favoring the intervention. Right: the Results text says between-group differences in blood pressure were not observed at 6 months, and Table 2 prints diastolic between-group differences whose 95% CIs include zero at both time points (orange: values printed in the paper). Below (blue): the 2-sided P values recomputed from Table 2's own mean (SD) changes and group sizes (.146 and .185), and those implied by the printed CIs (.151 and .160). The paper sets significance at 2-sided P < .05.
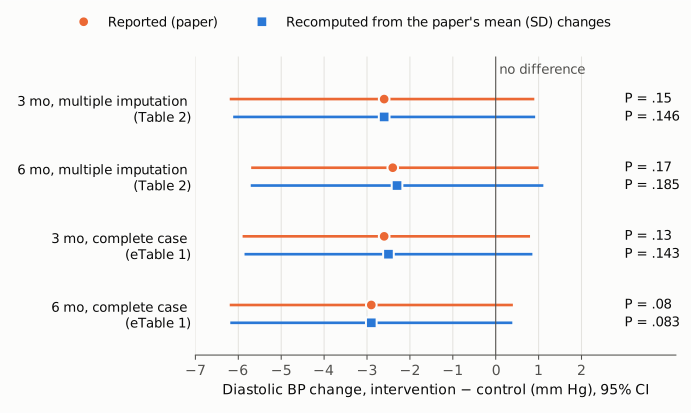
Figure 2. Between-group difference in change in diastolic blood pressure (intervention minus control, mm Hg) with 95% CIs, for every analysis the paper reports: multiple imputation (Table 2) and complete case (Supplement 1, eTable 1). Orange circles and lines are the printed values. Blue squares and lines are recomputed from the printed mean (SD) changes with a pooled-variance t interval; the complete-case rows assume a 66/66 and 66/65 group split, which eTable 1 does not print. The vertical line marks no difference. Every interval, printed or recomputed, crosses it, and the P values at right are all above .05.
Why it matters
Blood pressure is a prespecified secondary outcome (Methods, "Outcomes"). The abstract's Results paragraph is where a reader learns which secondary outcomes differed between arms, and as written it tells that reader that the app improved diastolic blood pressure relative to usual care. The paper's analyses instead show point estimates of about −2.4 to −2.9 mm Hg with intervals running from about −6 to about +1 mm Hg. That result is compatible with no effect, and the paper's own Results text describes it as no difference. Abstracts are what is indexed, screened for systematic reviews and quoted in secondary literature, so a secondary outcome reported there as a benefit can be carried forward as one. The paper has been cited about 88 times. Meta-analysts who extract from Table 2 would get the correct estimate; readers who rely on the abstract would not.
Two further features of the data argue for caution even about the point estimate. Blood pressure was analysed in 139 of 204 randomized participants (68.1%). Baseline diastolic pressure was 3.0 mm Hg higher in the control group (P = .023), an imbalance the paper reports but does not adjust for in any presented analysis.
The error is limited in scope. The title, Key Points and abstract Conclusions mention only weight, glycemic and medication outcomes. The primary outcome (weight change, −2.4 kg at 6 months, P < .001), HbA1c (−0.4%, P = .01) and fasting glucose stand on Table 2. The main-text Conclusions refer more broadly to "significant improvements in weight and multiple metabolic profiles"; of the metabolic outcomes in Table 2, only HbA1c and fasting glucose have between-group P < .05 at 6 months.
Explanations considered
-
A different time point. Table 2 and eTable 1 give diastolic results at 3 and 6 months only, with P from .08 to .17. No time point reaches P < .05. This does not account for the claim.
-
Within-group rather than between-group change. Footnote b marks the intervention arm's diastolic decrease as significant at both times, so "favoring the intervention" could describe a within-arm improvement. But the abstract says "Intergroup differences", and the control arm's 6-month decrease is also marked significant, so a within-group reading does not distinguish the arms. This does not account for the wording.
-
"Favoring" meaning only the direction of the point estimate. The other outcomes in the sentence (fasting glucose, dietary changes) are significant in Table 2. If direction alone were the criterion, systolic blood pressure (−4.2 and −2.8 mm Hg) and total and LDL cholesterol at 6 months would also qualify, and they are not listed. The paper's own Results sentence also treats the blood pressure result as no difference. This does not account for the claim.
-
A one-sided test. The Methods state 2-sided tests. One-sided P values implied by the printed CIs are .076 and .080 for the main analysis. Only the 6-month complete-case result would fall below .05 one-sided (.042), and the paper presents the complete-case analysis as a supplementary check. This does not account for the claim.
-
The paper's Benjamini-Hochberg procedure. BH adjustment can only raise a P value, so it cannot turn P = .15 or .17 into P < .05. For completeness: if all 21 between-group P values in Table 2 at a time point are treated as one family and q ≤ 0.20 is used as the criterion (the paper applies FDR 0.20 to within-group changes only), diastolic BP has q = .175 at 3 months and would pass, and q = .255 at 6 months and would not. On the same rule, systolic BP (q = .092), total cholesterol (q = .056) and LDL cholesterol (q = .173) would also pass at 3 months, and none of them appears in the abstract. The paper reports no between-group FDR analysis and sets significance at P < .05. This does not plausibly account for the claim.
-
A systolic/diastolic slip. The only blood pressure comparison in the paper with P < .05 is complete-case systolic BP at 3 months (P = .04, eTable 1). If the abstract meant systolic, it would still rest on a supplementary analysis at the earlier time point, with P = .07 in the main analysis. This would explain the word but not support the claim.
-
A baseline-adjusted analysis. Because baseline diastolic pressure was higher in the control group, an ANCOVA could give a larger estimate than the change-score analysis. As an illustration only, using the full-sample baseline gap from Table 1 (the 139-person subgroup's gap is not reported) and an assumed baseline coefficient between 0.3 and 1.0, the 6-month adjusted estimate would lie between −4.5 and −2.4 mm Hg. Its standard error cannot be derived from the published summaries. No such analysis is reported in the paper or supplement, so it cannot be the basis of the abstract statement.
-
Conversion or transcription artifact. The abstract sentence, the Results sentence and the Table 2 rows read identically in the publisher's page, the live PMC page and the PMC archive. The printed P values agree with their own CIs and with recomputation. No artifact is indicated.
Status
- Version of record. The publisher's article page (reached through doi.org, jamanetwork.com article 2780570) carries the same abstract sentence (the fetched text was cut off after "diastolic blood pressure"), the same Results sentence and the same Table 2 diastolic rows. The live PMC page and the archived PMC text match. All quotes from the article above were checked verbatim against the PMC-archived text; the eTable 1 rows were read from the supplement PDF.
- Supplements. Supplement 1 (eAppendix, eFigures 1–2, eTables 1–3), Supplement 2 (trial protocol) and Supplement 3 (data-sharing statement) were obtained from the Europe PMC supplementary-files archive. eTable 1, the complete-case analysis, does not resolve the discrepancy (diastolic P = .13 and .08). No individual-level data are posted, so the mixed model could not be rerun.
- Corrections. As of 2026-10-23 no correction, erratum, retraction or expression of concern was found: Crossref lists no update relations for the DOI, the Crossref/Retraction Watch data have no entry, Europe PMC (PMID 34081137) lists no comment or correction links, PubMed lists no linked notices, and the PMC page shows none.
- PubPeer. PubPeer's search page and API returned an access challenge (HTTP 403) to automated queries, and a web search could not be run in this session, so PubPeer comments could not be checked.
- Related observations (not the subject of this note). (i) The abstract gives P = .001 for the 6-month HbA1c difference in the subgroup with baseline HbA1c ≥ 8%; the Results text and Table 3 give P = .02 for the same comparison (−0.9%, 95% CI −1.6 to −0.1), whose CI implies P = .019 (Welch from the Table 3 summaries: .039). (ii) In Table 2 the 6-month fasting glucose CI (−23.4 to −3.6) is identical to the 3-month CI; its midpoint is −13.5 rather than the printed −12.6, and recomputation gives −21.4 to −3.8 (P = .005). Neither changes a conclusion.
Suggested correction
In the Abstract, Results, replace
Intergroup differences favoring the intervention were also noted for fasting blood glucose, diastolic blood pressure, and dietary changes.
with, for example,
Intergroup differences favoring the intervention were also noted for fasting blood glucose and dietary changes; between-group differences in blood pressure were not statistically significant (diastolic blood pressure at 6 months, −2.4 mm Hg [95% CI, −5.7 to 1.0]; P = .17).
If the authors intended a baseline-adjusted or other analysis, that analysis and its result should be reported in the Results and the supplement before it is summarized in the abstract. The editors may also wish to check the abstract's P = .001 for the HbA1c ≥ 8% subgroup against the P = .02 in the Results and Table 3, and the 6-month fasting glucose CI in Table 2.