← Back to the plain-language case
Abstract reports group 2's 1-year vaccine efficacy, 77% (67–84), as the value for group 1
Lancet (2021) · doi:10.1016/S0140-6736(21)00943-0 · PMC8121760
Summary
The abstract of this phase 2b trial of the R21/Matrix-M malaria vaccine has one 1-year efficacy figure: "77% (67–84) in group 1", where group 1 is the lower adjuvant dose (25 μg Matrix-M). Results paragraph 3 (unadjusted) and Table 1 (unadjusted and adjusted) give group 1 a 12-month efficacy of 71% (59–79). The value 77% (67–84) is group 2's 12-month estimate (50 μg Matrix-M), matching to the point estimate and both confidence limits, and no group-1 estimate anywhere in the paper equals it. The paper reads efficacy against a WHO goal of at least 75%. Read alone, the abstract places the lower-dose arm above that goal at 1 year and has its efficacy rising from 74% at 6 months, when the paper's own data show it below the goal and falling.
What the paper reports
Abstract, Findings:
Vaccine efficacy was 74% (95% CI 63–82) in group 1 and 77% (67–84) in group 2 at 6 months. At 1 year, vaccine efficacy remained high, at 77% (67–84) in group 1.
Abstract, Methods (the group definitions):
Group 1 received 5 μg R21 plus 25 μg MM, group 2 received 5 μg R21 plus 50 μg MM, and group 3, the control group, received rabies vaccinations.
Results, second paragraph (6 months, primary endpoint):
These cases of clinical malaria occurred in 43 (29%) of 146 participants in group 1, 38 (26%) of 146 participants in group 2, and 105 (71%) of 147 participants in group 3. A Cox regression model comparing group 1 with group 3 resulted in vaccine efficacy of 74% (95% CI 63–82; p<0·0001). Comparing group 2 with group 3 resulted in 77% efficacy (67–84; p<0·0001; figure 2).
Results, third paragraph (12 months):
These cases occurred in 50 (34%) of 146 participants in group 1, 39 (27%) of 146 participants in group 2, and 106 (72%) of 147 participants in group 3. Cox regression showed vaccine efficacy of 71% (95% CI 59–79; p<0·0001) for group 1, and 77% (67–84; p<0·0001) for group 2 (figure 2).
Table 1, primary case definition (>5000 parasites per μL), columns: timepoint | cases | unadjusted efficacy | adjusted efficacy:
Group 1 … 12 | 50/146 (34%) | 71% (59–79) | 71% (59–79)
Group 2 … 12 | 39/146 (27%) | 77% (67–84) | 76% (65–84)
Discussion, first paragraph (reference number after "75% or more" omitted):
We report malaria vaccine efficacy that reaches the WHO-specified efficacy goal of 75% or more in the target population of African children, over 12 months of follow-up. Efficacy of 77% was observed in the children who received R21 plus the higher dose of MM adjuvant
Discussion, seventh paragraph:
Efficacy with R21 and the higher adjuvant MM dose, administered largely before the malaria season, was 77% (95% CI 67–84), compared with 44% (37–50) reported for RTS,S/AS01 at this site
Research in context, Added value of this study:
This new vaccine, R21 adjuvanted with 50 μg Matrix-M (R21/MM), administered before the malaria season, demonstrates high-level efficacy, reaching the WHO-specified efficacy goal of at least 75% in the target population of African children over 1 year.
What the paper's own numbers show
Method. Table 1 states that efficacy is 1 minus the Cox hazard ratio. I made three checks, all printed by recompute.py.txt. (1) I compared the abstract's triplet, 77% (67–84), with every group-1 estimate printed in the paper and with the group-2 estimates. (2) Cox estimates cannot be reproduced exactly without event times, so as an independent check I approximated each efficacy from the printed case counts as 1 minus the ratio of cumulative hazards, with H = −ln(1 − cases/N) and SE(log HR) ≈ √(1/d₁ + 1/d₂). This approximation runs 1.1 to 3.8 points below Table 1 in all four cells, so it is useful for direction and size, not for the exact value. (3) I counted the new first cases between 6 and 12 months among the children still case-free at 6 months.
| Quantity | Location | Reported | Recomputed |
|---|---|---|---|
| Group 1, 12 months | Abstract | 77% (67–84) | does not match any group-1 estimate in the paper |
| Group 1, 12 months, unadjusted | Results para 3; Table 1 | 71% (59–79) | HR 0.29 (0.21–0.41); count-based approximation 67.2% (54–77) |
| Group 1, 12 months, adjusted | Table 1 | 71% (59–79) | not 77% (67–84) |
| Group 2, 12 months, unadjusted | Results para 3; Table 1; Discussion | 77% (67–84) | identical to the abstract's "group 1" triplet; HR 0.23 (0.16–0.33); approximation 75.7% (65–83) |
| Group 1, 6 months | Abstract; Results para 2; Table 1 | 74% (63–82) | approximation 72.2% (60–80) |
| Group 2, 6 months | Abstract; Results para 2; Table 1 | 77% (67–84) | approximation 75.9% (65–83) |
| New first cases, 6 to 12 months | Results; Table 1 (43→50, 38→39, 105→106) | — | group 1: 7 of 103 still at risk (6.8%); group 2: 1 of 108 (0.9%); control: 1 of 42 (2.4%) |
| Change in group 1 efficacy, 6 to 12 months | Abstract vs Table 1 | abstract implies 74% → 77% | Table 1 74% → 71%; approximation 72.2% → 67.2% (−5.0 points) |
| Other group-1 estimates (secondary definition; Results para 5 adjusted; groups 1+2 pooled) | Table 1; Results paras 4–5 | 70% to 75%, CIs 60–81 | none equals 77% (67–84) |
| Group 1 and group 2, 12 months, all episodes (negative binomial rate ratio; a different measure from the Cox first-episode estimate) | Appendix p 2, Supplementary Table 2b | 69.6% (58.7–77.6) and 75.7% (66.3–82.4) | group 1 below 75% and below group 2; neither equals 77% (67–84) |
| Overstatement of group 1 at 12 months | Abstract | — | 6 percentage points; crosses the 75% goal |
Group 1 gained seven new cases between 6 and 12 months against one in the control group. Over that interval the risk in group 1 was higher than in the controls who were still case-free, so the 12-month estimate for group 1 should be lower than its 6-month estimate. Table 1 shows that fall (74% to 71%). The abstract's statement that group 1 "remained high, at 77%" would need a rise.
Figure
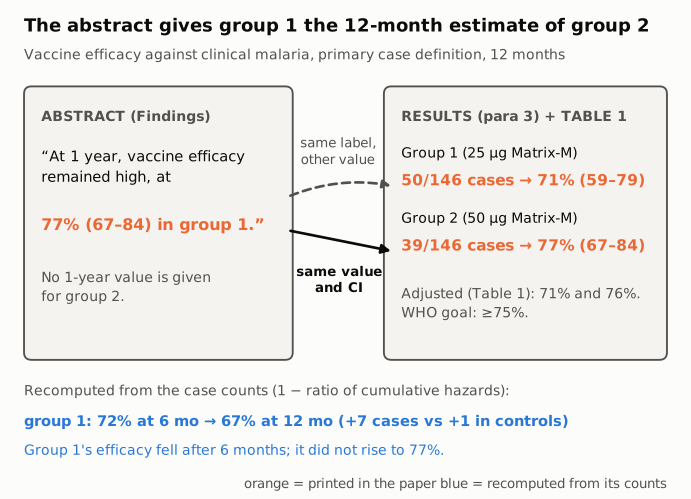
Figure 1. Left: the abstract's only 1-year efficacy sentence. Right: the 12-month values for the two vaccine arms as printed in Results paragraph 3 and Table 1 (primary case definition, unadjusted Cox). The solid arrow links the abstract's triplet to the identical group-2 row; the dashed arrow links it to the group-1 row, which has the same label and a different value. Orange text is printed in the paper. Blue text at the bottom is recomputed by recompute.py.txt from the paper's case counts as 1 minus the ratio of cumulative hazards (an approximation to the Cox estimate).
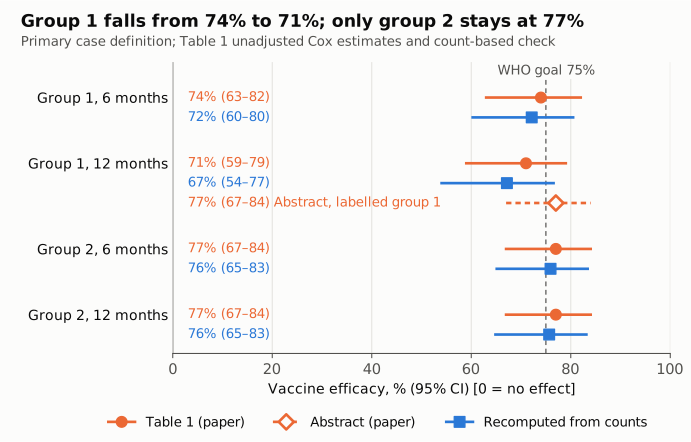
Figure 2. Vaccine efficacy (%, 95% CI) on one linear axis from 0 (no effect, solid line) to 100, with the WHO goal of 75% as a dashed line. Orange circles: Table 1 unadjusted Cox estimates. Open orange diamond with dashed interval: the abstract's 1-year value for group 1. Blue squares: approximations recomputed from the printed case counts. The abstract's value sits with the group-2 rows, not with group 1, whose estimate falls between 6 and 12 months by both the Cox and the count-based measure.
Why it matters
- It is the abstract's only 1-year efficacy statement. The abstract gives no 1-year value for group 2, so a reader of the abstract alone sees one 1-year number, and it is attached to the wrong arm.
- It moves the lower dose across the threshold the paper uses. The paper frames its result against the WHO goal of at least 75%. Group 1's correct 12-month efficacy, 71% (59–79), is below that goal; the abstract's 77% is above it. With the error, both adjuvant doses appear to meet the goal at 1 year. In the paper's own data only the 50 μg dose does.
- The abstract does not show the waning in the lower-dose arm or the gap between doses. The abstract shows group 1 going from 74% to 77%. The data show it falling to 71% while group 2 holds at 77%, a 6-point 12-month difference that bears on the choice of adjuvant dose. The paper reports no significant difference between groups 1 and 2, and that statement is not affected.
- The main conclusions are not affected. The Research in context panel and the Discussion attribute the 75% claim to the 50 μg dose, and that dose's 12-month efficacy is 77% (67–84) as reported. The title ("Efficacy of a low-dose candidate malaria vaccine…") and the abstract's Interpretation ("shows promising high-level efficacy") make no dose-specific or 75% claim. None of these is affected. Group 1's efficacy remains large and significant (p<0·0001, lower confidence limit 59%). The error is in which arm the abstract names, not in the analysis.
Explanations considered
- Adjusted rather than unadjusted estimate. Does not account for it. Table 1's adjusted 12-month value for group 1 is also 71% (59–79). The separately reported adjusted value in Results paragraph 5 is 75% (67–81), which differs in the point estimate and both limits.
- Secondary case definition. Does not account for it. Group 1 at 12 months is 70% (60–78) unadjusted and 71% (60–79) adjusted.
- Groups 1 and 2 pooled. Does not account for it. The pooled 12-month value is 74% (65–80) unadjusted and 73% (65–80) adjusted.
- A different time point. Does not account for it. Group 1's 6-month value is 74% (63–82), and the same abstract sentence already reports it. The 6-month and 12-month values for group 2 are both 77% (67–84).
- The value belongs to group 2. Accounts for it fully. 77% (67–84) is group 2's 12-month unadjusted estimate in Results paragraph 3 and Table 1, and the Discussion gives the same figure to "the higher dose of MM adjuvant" over 12 months. The group label in the abstract is the only element that differs.
- An archive or conversion artifact. Ruled out. The same sentence appears in the PMC text, the Europe PMC full-text XML and the PubMed abstract (PMID 33964223). The conflict is a group number and a whole triplet of values, not a symbol or digit that could be lost in conversion.
- A different outcome measure. Does not account for it. The appendix (p 2, Supplementary Table 2b) gives 12-month protective efficacy against all malaria episodes, from a negative binomial rate ratio, of 69.6% (58.7–77.6) for group 1 and 75.7% (66.3–82.4) for group 2. This is a different measure from the Cox estimate of time to first episode, so it is not expected to match Table 1, but it independently puts group 1 below 75% and below group 2, and neither value equals 77% (67–84).
- A side inconsistency nearby, which does not explain the main one. Results paragraph 5 reports adjusted 12-month efficacies of 75% (67–81) for group 1 and 77% (65–80) for group 2 "(table 1)", while Table 1's adjusted column gives 71% (59–79) and 76% (65–84). The 77% (65–80) interval is also lopsided on the hazard-ratio scale (log-distance 0.14 below the estimate and 0.42 above, a ratio of 3.0), whereas in all 24 Table 1 intervals the two log-distances differ by a ratio of at most 1.2. The 6-month group-1 count is printed as 29% in the abstract and Results and as 30% in Table 1; 43/146 is 29.45%.
Status
- Version of record. The publisher's pages (thelancet.com, and linkinghub.elsevier.com via the DOI) did not return the article text to automated requests. The publisher-deposited text was checked in the Europe PMC full-text XML for PMC8121760 and in the PubMed record (PMID 33964223), and both carry the abstract sentence "At 1 year, vaccine efficacy remained high, at 77% (67–84) in group 1." Results paragraph 3 and Table 1 in the Europe PMC XML give group 1 at 71% (59–79). Every quotation above was checked verbatim against the PMC-archived text with
src/show.py. - Supplements. The supplementary appendix (mmc1.pdf, 111 pages: case-incidence tables, the trial protocol and the statistical analysis plan) was downloaded from the Europe PMC supplementaryFiles endpoint and examined. It contains no Cox efficacy estimates by group beyond those in the paper, and no value of 77% (67–84) for group 1. Its Supplementary Table 2b (appendix p 2) gives 12-month protective efficacy against all malaria episodes (negative binomial rate ratio) of 69.6% (58.7–77.6) for group 1 and 75.7% (66.3–82.4) for group 2, which corroborates the ordering in Table 1 by a different measure. No participant-level data are published; the paper states that anonymised participant data will be made available on request when the trial is complete.
- Corrections and comments. As of 2026-10-24 no correction, erratum or retraction notice was found.
src/known.pyreturns no Crossref update relations, no PMC notices and no Europe PMC notices. The Europe PMC record lists only a "Comment in" link to the accompanying commentary (doi:10.1016/S0140-6736(21)01065-5). PubPeer's API returned HTTP 403 to automated requests, and a web search for the title with "PubPeer" found no thread. - Sources. PMC article PMC8121760; Europe PMC REST search, full-text XML and supplementaryFiles (appendix mmc1.pdf) for PMC8121760; PubMed 33964223; Crossref; PubPeer; https://doi.org/10.1016/S0140-6736(21)00943-0.
Suggested correction
In the abstract, Findings, replace
At 1 year, vaccine efficacy remained high, at 77% (67–84) in group 1.
with
At 1 year, vaccine efficacy was 71% (59–79) in group 1 and 77% (67–84) in group 2.
This agrees with Results paragraph 3 and Table 1. The authors may also wish to reconcile the adjusted 12-month estimates in Results paragraph 5, 75% (67–81) and 77% (65–80), with Table 1's adjusted column, 71% (59–79) and 76% (65–84), and the 29% versus 30% rounding of 43/146.