← Back to the plain-language case
Abstract says ALT was lower in COVID-19 patients than controls; Table 1 shows it higher
PLoS Pathog (2021) · doi:10.1371/journal.ppat.1009420 · PMC8026060
Summary
This retrospective study compares 681 COVID-19 patients with 369 normal controls, split by sex and age. The second sentence of the Abstract says that, compared with age-matched controls, non-comorbid patients in all four age and sex groups had lower lymphocyte counts and lower alanine aminotransferase (ALT). The paper's own Table 1 shows that median ALT was higher in patients than in their matched controls in all four groups: by 10.0 and 2.0 IU/L in young males and young females (P < 0.0001 and P = 0.0008), and by 8.0 and 1.8 IU/L in old males and old females (not significant). The share of people with ALT above the upper normal limit was also higher among patients in every group. The Results text and the Discussion agree with the table, so the error is confined to one Abstract sentence. That sentence reverses the direction of a liver-function finding and conflicts with the paper's own conclusion about liver damage.
What the paper reports
Abstract, second sentence:
Compared to the age-matched NCs, both young and old male and female non-comorbid COVID-19 patients had lower lymphocyte counts and alanine aminotransferase (ALT) concentration, and only young male and female patients had lower neutrophil counts.
Results, "Laboratory findings of male and female patients with COVID-19", first paragraph:
Compared to the young and old normal controls (NCs), both age-matched male and female COVID-19 patients had more cases with leukocyte and lymphocyte counts below the normal lower limit (NLL) and ALT concentrations above the normal upper limit (NUL).
Discussion, first paragraph:
In this retrospective study, we found that SARS-CoV-2 infection decreases blood neutrophil and lymphocyte counts in both male and female patients and damages liver function.
Results, "Baseline characteristics" (the population of the Table 1 patient columns):
Of 681 patients, 438 (223 males and 215 females) suffered from COVID-19 without comorbidities. Of these 438 patients, 285 were young (65.0%, 146 males and 139 females) and 153 were old (35.0%, 77 males and 76 females).
Table 1, ALT rows. Columns are normal controls (young males, young females, old males, old females), then patients in the same order, then P-values e to l:
ALT, IU/L | M: 5–40 F: 5–35 | 17.0 (13.0–25.0) | 11.0 (9.0–14.0)aaaa | 21.0(17.8–26.0) | 17.0(14.0–21.8) | 27.0 (17.1–42.0) | 13.0 (11.0–21.0)cccc | 29.0 (21.0–50.5) | 18.8 (14.0–27.5)dd | >0.999 | <0.0001 | >0.999 | 0.011 | <0.0001 | 0.308 | 0.0008 | >0.999
Male >40 IU/L; Female >35 IU/L | | 12/160 (7.5) | 2/103 (1.9) | 2/50(4.0) | 2/56(3.6) | 37/143 (25.9) | 11/137 (8.0)cccc | 26/76 (34.2) | 12/76 (15.8)dd | 0.588 | 0.923 | 0.195 | 0.080 | <0.0001 | <0.0001 | 0.039 | 0.024
Table 1 footer, which defines the matched patient-versus-control P values:
P-valuei for comparison of the young normal males vs. young male patients with COVID-19.P-valuej for comparison of the old normal males vs. old male patients with COVID-19.P-valuek for comparison of the young normal females vs. young female patients with COVID-19.P-valuel for comparison of the old normal females vs. old female patients with COVID-19.
What the paper's own numbers show
Method. Table 1 prints median ALT (IQR) for each of the eight columns, and the footer says which P value belongs to each patient-versus-control comparison. For each age and sex group I subtracted the control median from the patient median and read off the paper's matched P value (i, j, k or l). For the row giving ALT above the upper normal limit, I recomputed the two proportions and tested each 2×2 table with Fisher's exact test, Yates-corrected χ² and uncorrected χ². The footer says the paper used one of these, "as appropriate". As controls, I made the same comparison for the lymphocyte and neutrophil halves of the Abstract sentence, and I checked that the Table 1 patients are the non-comorbid population the sentence describes. Every number below is printed by recompute.py.txt.
| Quantity | Location | Reported | Recomputed from the paper's numbers |
|---|---|---|---|
| Direction of patient vs control ALT | Abstract, sentence 2 | lower in all four groups | higher in 4 of 4 groups, lower in 0 of 4 |
| Median ALT, young males | Table 1, ALT row; P-value i | 17.0 vs 27.0 IU/L; P < 0.0001 | patients +10.0 IU/L (ratio 1.59), significant |
| Median ALT, young females | Table 1, ALT row; P-value k | 11.0 vs 13.0 IU/L; P = 0.0008 | patients +2.0 IU/L (ratio 1.18), significant |
| Median ALT, old males | Table 1, ALT row; P-value j | 21.0 vs 29.0 IU/L; P = 0.308 | patients +8.0 IU/L (ratio 1.38), not significant |
| Median ALT, old females | Table 1, ALT row; P-value l | 17.0 vs 18.8 IU/L; P > 0.999 | patients +1.8 IU/L (ratio 1.11), not significant |
| ALT above upper normal limit, young males | Table 1, ">40 / >35 IU/L" row | 12/160 (7.5) vs 37/143 (25.9); P < 0.0001 | +18.4 percentage points; Fisher P = 1.7×10⁻⁵ |
| ALT above upper normal limit, young females | same row | 2/103 (1.9) vs 11/137 (8.0); P = 0.039 | +6.1 points; uncorrected χ² P = 0.039 (matches); Fisher P = 0.046 |
| ALT above upper normal limit, old males | same row | 2/50 (4.0) vs 26/76 (34.2); P < 0.0001 | +30.2 points; Fisher P = 4.5×10⁻⁵ |
| ALT above upper normal limit, old females | same row | 2/56 (3.6) vs 12/76 (15.8); P = 0.024 | +12.2 points; uncorrected χ² P = 0.024 (matches); Fisher P = 0.042 |
| Lymphocyte count, same sentence (control) | Table 1, lymphocyte row | 1.9 / 1.8 / 1.9 / 1.9 vs 1.3 / 1.3 / 1.2 / 1.2 ×10⁹/L; all P < 0.0001 | lower in 4 of 4 groups: consistent with the Abstract |
| Neutrophil count, same sentence (control) | Table 1, neutrophil row | lower only in young groups (P 0.009 and < 0.0001); old groups P > 0.9999 | consistent with "only young male and female patients had lower neutrophil counts" |
| Table 1 patient population | Results, Baseline characteristics; Table 1 header | 146 + 139 + 77 + 76 non-comorbid patients | 438 = 681 − 243: the non-comorbid population the Abstract sentence names |
Every patient group has a higher median ALT than its matched control group, and a larger share of patients than controls has ALT above the upper normal limit. The increase in medians is statistically significant in both young groups. It is not significant in either old group, but it points the same way. No group shows lower ALT. The other two claims in the same Abstract sentence, on lymphocytes and neutrophils, match Table 1, so the comparison method and the column reading reproduce the paper wherever the Abstract is right.
One detail of the table can mislead a reader. The "cccc" mark on the young-female patient median (13.0) means a difference from young male patients. The young-female patient-versus-control P value is P-value k = 0.0008. Either way, the comparison is significant and shows patients higher.
Figure
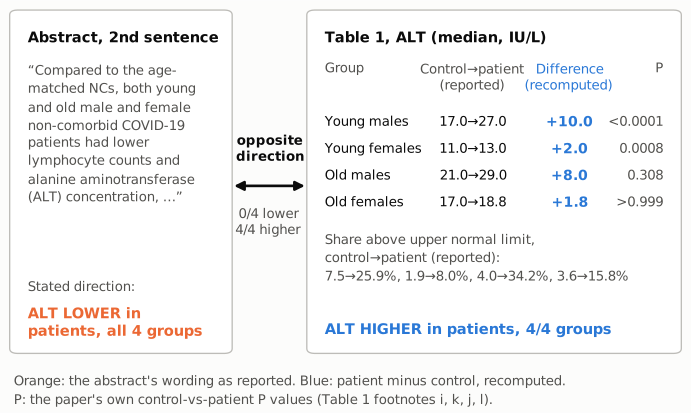
Figure 1. The left panel is the Abstract sentence as printed, which gives the direction of the patient-versus-control ALT comparison as lower (orange). The right panel holds the Table 1 values for the same comparison. Each row gives the matched control and patient medians in IU/L, the patient-minus-control difference recomputed from them (blue) and the paper's own P value for that comparison (footnotes i, k, j and l). Below the rows are the reported shares with ALT above the upper normal limit, control then patient, in the same group order. In all four groups the patient value exceeds the control value, which is the opposite of the direction the Abstract states.
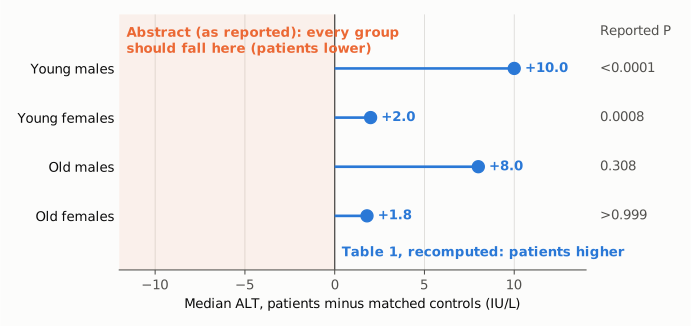
Figure 2. For each group, the patient-minus-control difference in median ALT recomputed from Table 1 (blue dots), with zero as the reference line. The shaded region left of zero is where the Abstract's statement places every group (patients lower). The column on the right gives the paper's matched P values. All four differences are positive, and the two young-group differences are statistically significant by the paper's own tests.
Why it matters
The Abstract is the part of a paper that most readers see, and it is what indexing services and secondary summaries carry. Taken at face value, the sentence says that SARS-CoV-2 infection goes with lower ALT, which would mean less hepatocellular injury in patients than in healthy controls. The paper's data show the reverse: higher median ALT, significant in the young groups, and a share of patients 3.4 to 8.6 times that of controls of patients with ALT above the upper normal limit (25.9% vs 7.5%, 8.0% vs 1.9%, 34.2% vs 4.0% and 15.8% vs 3.6%). The sentence also contradicts the paper's own conclusions. The Discussion says SARS-CoV-2 infection "damages liver function", and the Abstract's last sentences describe associations with "liver damage". A reader who compares the Abstract with those conclusions meets a contradiction that the body of the paper resolves in favour of higher ALT.
The paper's main conclusions are not affected. The sex and age effects on ALT rest on comparisons among patients and on the Table 2 regressions (ALT on female sex β = −0.281, P < 0.0001; on age β = 0.114, P = 0.002), not on the control comparison. The lymphocyte and neutrophil statements in the same sentence are supported by Table 1.
Explanations considered
- Misreading of the column order. The table header and the footer both fix the order: controls young male, young female, old male, old female, then patients in the same order. The footer gives an explicit P value (i, j, k, l) for each matched pair. With that pairing, all four differences are positive. The same reading reproduces the lymphocyte and neutrophil halves of the sentence exactly, so the columns are being read correctly.
- A different population. The Abstract sentence refers to "non-comorbid COVID-19 patients". The Table 1 patient columns sum to 146 + 139 + 77 + 76 = 438, the non-comorbid count given in the Results (681 − 243). The ALT denominators (143, 137, 76, 76) are within those groups, so some patients lacked an ALT value, but the population is the same. Supplementary S1 Table covers all 681 patients and has no control columns, so it cannot be the source of a different patient-versus-control direction.
- A different ALT measure. Table 1 has two ALT rows, the median concentration and the share above the upper normal limit. Both show patients higher in all four groups. There is no row for ALT below a lower limit. The Results do mention ALT "below the NLL", but only when comparing female with male patients, not patients with controls.
- "Lower" applying only to lymphocytes. As printed, "lower" governs both "lymphocyte counts and alanine aminotransferase (ALT) concentration". Even read as loosely as possible, the sentence gives no direction for ALT that the table supports, and the Results sentence on the same comparison says patients had more cases above the upper normal limit.
- Only the non-significant groups. The Abstract says "both young and old". In the two old groups the median difference is not significant, but it is positive. In the two young groups it is significant and positive. No subset of groups shows lower ALT.
- Conversion or version artifact. The PMC text, the Europe PMC full-text XML, the publisher's HTML (Version 2) and the publisher's PDF carry the same Abstract sentence and the same Table 1 ALT rows. The first online version was labelled an uncorrected proof, and the current version shows no correction notice.
- Choice of test for the above-limit proportions. The reported P values for young and old females (0.039, 0.024) match uncorrected χ². Fisher's exact test gives 0.046 and 0.042, so whichever test the paper used, the conclusion is the same. This affects only the strength of those two comparisons, not their direction.
None of these explanations accounts for the Abstract's direction. All of the paper's own numbers on this comparison point the other way.
Status
- Version of record. The publisher's article page (journals.plos.org, reached via doi.org) shows Version 2, with Version 1 labelled "Uncorrected Proof", published March 26, 2021. Its Abstract carries the sentence quoted above. The publisher PDF (16 pages, created 2021-04-01) and the Europe PMC full-text XML carry the same sentence, and their Table 1 ALT rows match the PMC table cell for cell. Every quotation above was checked verbatim against the PMC-archived text with
src/show.py. - Supplements. There are six: S1 to S6 Tables. S1 Table (sex- and age-specific characteristics of COVID-19 patients on admission, DOCX) covers only the 681 patients and has no normal-control columns. S2 to S6 Tables are the supporting data for Fig 1A to 1E. None bears on the patient-versus-control ALT direction.
- Corrections and comments. As of 2026-10-24 I found no correction, erratum, expression of concern or retraction.
src/known.pyreturns only a Crossref "new_version" self-relation dated 2021-04-07, which fits the move from uncorrected proof to final version, and no PMC or Europe PMC notices. The publisher page shows no correction notice and no reader comment count. PubPeer's search API refused automated access (HTTP 403), so PubPeer could not be queried directly. A web search for the title together with "PubPeer" found no thread for this article. - Sources. PMC article PMC8026060; Europe PMC full-text XML for PMC8026060; publisher HTML and PDF at journals.plos.org (doi:10.1371/journal.ppat.1009420); S1 Table (DOCX); Crossref; Europe PMC; PubPeer (not reachable).
Suggested correction
- Revise the Abstract's second sentence so that the ALT direction matches Table 1, for example: "Compared to the age-matched NCs, both young and old male and female non-comorbid COVID-19 patients had lower lymphocyte counts and more frequent ALT concentrations above the normal upper limit, with significantly higher median ALT in young male and female patients, and only young male and female patients had lower neutrophil counts."
- Optionally, state in the Table 1 footer which test produced each P value in the ">40 / >35 IU/L" row. The two female values match uncorrected χ² rather than Yates-corrected χ² or Fisher's exact test.