← Back to the plain-language case
Mortality-rate 95% CI is far narrower than two deaths in 610.1 person-years allow
Diabetes Care (2021) · doi:10.2337/dc20-2458 · PMC7985423
Summary
This research letter reports 2 deaths among 49 islet-transplant recipients over 610.1 person-years, and a mortality rate of 3.28 (95% CI 2.12–5.05) per 1,000 person-years. The point estimate is correct (2 / 610.1 × 1,000 = 3.278), but the interval cannot come from 2 deaths: the exact Poisson 95% CI is 0.40–11.84, and no standard method gives a lower limit above 0.90 or an upper limit below 7.82. The printed interval is about as wide as one would expect from 20 to 23 deaths. This matters because the printed upper limit (5.05) lies just below all three comparator-cohort rates quoted in the letter (5.31, 7.99 and 10.79), whereas the correct interval contains all three.
What the paper reports
Results paragraph (cohort):
we retrospectively evaluated a cohort of 49 T1D subjects who underwent ITx and were followed during 2000–2020
Results paragraph (follow-up):
Person-years of follow-up was 610.1, and time after ITx was median (25th–75th) 13.8 (8.2–17.7) years.
Results paragraph (deaths):
Two subjects (4.08%) with T1D diagnosis in 1963 and 1977, respectively, died during the 20-year follow-up.
Results paragraph (the rate and its interval):
incidence rate of mortality (95% CI) was 3.28 (2.12–5.05) per 1,000 person-years (Fig. 1)
Discussion paragraph (comparator rates):
The Pittsburgh Epidemiology of Diabetes Complications Study cohort observed a mortality incidence rate of 10.79 per 1,000 person-years (T1D diagnosis between 1950 and 1980) and 5.31 per 1,000 person-years in the subcohort (66.9%) diagnosed between 1965 and 1980.
The population-based Allegheny County Type 1 Diabetes Registry cohort, with T1D diagnosed between 1965 and 1979, showed an incidence rate of mortality of 7.99 per 1,000 person-years.
Discussion paragraph (interpretation):
In our study, we observed a lower mortality incidence rate, although these comparisons are limited by the eligibility criteria, including absence of albuminuria.
Our results suggest that ITx is not associated with increased mortality regardless of the use of long-term immunosuppressive therapy.
It is reasonable to consider the hypothesis that the lowest cumulative hyperglycemic exposure and prevention of SHEs provided by ITx represent protection against cardiovascular disease and mortality in patients with T1D.
Figure 1 legend (excerpt):
Mortality incidence rate in 1,000 person-years (bar graph inset).
The letter names no CI method, model or adjustment. The only analyses it describes are a Kaplan–Meier curve and this crude incidence rate.
What the paper's own numbers show
Method. A crude mortality rate is d / PY, with the number of deaths d treated as Poisson. The exact (Garwood) 95% CI for the count is [χ²(0.025; 2d) / 2, χ²(0.975; 2d + 2) / 2], divided by the person-years. For comparison I also computed the mid-p exact, Byar, score, Jeffreys, log-Wald (SE of the log rate = 1/√d) and plain Wald intervals. Because SE(log rate) = 1/√d, the width of a CI on the log scale shows how many events it was computed from. I applied this to the printed interval, and I checked the rounding range of the printed limits. Every number below is printed by recompute.py.txt.
| Quantity | Location | Reported | Recomputed from the paper's numbers |
|---|---|---|---|
| Deaths, % of cohort | Results | 2 (4.08%) of 49 | 2/49 = 4.08% |
| Mortality rate per 1,000 PY | Results | 3.28 | 2 / 610.1 × 1,000 = 3.278 |
| 95% CI, exact Poisson (Garwood) | Results | 2.12–5.05 | 0.40–11.84 |
| 95% CI, mid-p exact | Results | 2.12–5.05 | 0.55–10.83 |
| 95% CI, log-Wald (SE = 1/√2) | Results | 2.12–5.05 | 0.82–13.11 |
| 95% CI, score / Jeffreys / Byar | Results | 2.12–5.05 | 0.90–11.95 / 0.68–10.52 / 0.37–11.84 |
| 95% CI, Wald (normal) | Results | 2.12–5.05 | −1.27 to 7.82 |
| Upper / lower limit ratio (log-scale width) | derived | 5.05 / 2.12 = 2.38 (0.87) | exact 29.8 (3.39, 3.9 times wider); log-Wald 16.0 (2.77) |
| Centering of the printed limits | derived | 3.28 | geometric mean 3.27; est/lower 1.547, upper/est 1.540 |
| SE(log rate) implied by the printed CI | derived | 0.221 | 2 deaths give 1/√2 = 0.707 (3.2 times larger) |
| Events implied by the printed width | derived | 2 deaths | 1/0.221² = 20.4 (20.2–20.6 over the rounding range of the limits); exact-CI width matches about 23 |
| Exact 95% CI at rate 3.28 with 20 / 21 / 25 events | derived | 2.12–5.05 | 2.00–5.07 / 2.03–5.01 / 2.12–4.84 |
| Confidence level the printed CI would have (log-Wald, d = 2) | derived | 95% | 46.1% |
| Exact CI at lower confidence levels, d = 2 | derived | 2.12–5.05 | 90%: 0.58–10.32; 80%: 0.87–8.72; 50%: 1.58–6.43 |
All standard 95% methods give a lower limit between 0.37 and 0.90 (the plain Wald limit is negative) and an upper limit between 7.82 and 13.11. The printed interval 2.12–5.05 lies inside every one of them and on the log scale the exact interval is 3.9 times as wide (3.39 against 0.87). Its limits are almost symmetric around 3.28 on the log scale, which fits a log-Wald construction with about 20 events. It does not fit the 2 deaths that the letter reports.
Figure
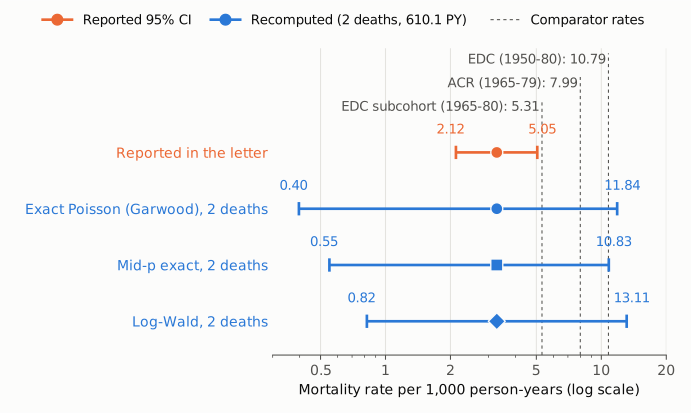
Figure 1. The mortality rate per 1,000 person-years on a log scale. Orange: the 95% CI printed in the letter, 2.12–5.05. Blue: 95% CIs recomputed from the letter's own 2 deaths in 610.1 person-years by three standard methods (exact Poisson 0.40–11.84, mid-p 0.55–10.83, log-Wald 0.82–13.11). Markers sit at the point estimate, 3.28, which all rows share. The dashed lines mark the three comparator rates quoted in the letter's Discussion (EDC subcohort 5.31, Allegheny County Registry 7.99, EDC 10.79). The printed interval ends just below all three. Every recomputed interval contains all three.
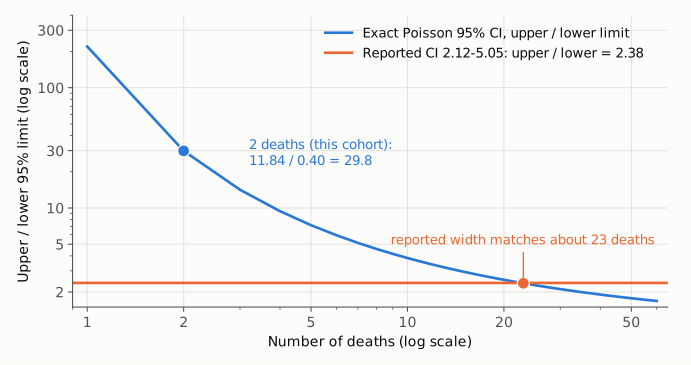
Figure 2. The width of an exact Poisson 95% CI for a rate, expressed as the ratio of its upper to its lower limit, depends only on the number of events (blue curve). With the cohort's 2 deaths the ratio is 11.84 / 0.40 = 29.8. The printed interval has a ratio of 5.05 / 2.12 = 2.38 (orange line), which the exact interval reaches only at about 23 deaths. A log-Wald construction gives about 20 (table above).
Why it matters
The mortality rate is the letter's main quantitative result. It is the only estimate given with a confidence interval, and Figure 1's inset compares it with the rates of other cohorts. The point estimate is unaffected. The interval, however, overstates the precision of a rate based on 2 deaths: its implied log-scale standard error is 0.221, against 0.707 for 2 events, and the exact interval is 3.9 times as wide on the log scale.
The comparison with other cohorts depends on that precision. With the printed interval, all three comparator rates (5.31, 7.99, 10.79) lie above the upper limit (5.05), which reads as a clearly lower mortality in transplant recipients. With the correct interval (0.40–11.84) all three lie inside it. Put as a one-sided Poisson calculation, a cohort with 610.1 person-years would see 2 or fewer deaths with probability 0.37 if its true rate were 5.31, 0.14 at 7.99, and 0.04 at 10.79. Only the oldest comparator (diagnosed 1950–1980) is borderline, and the letter itself notes that the transplant cohort was selected for absence of albuminuria.
The letter's cautious statements hold: "we observed a lower mortality incidence rate" is true of the point estimates, and the letter already says that "these comparisons are limited by the eligibility criteria". The conclusion that transplantation "is not associated with increased mortality" remains consistent with the data, but the data cannot exclude a mortality rate as high as that of the comparison populations. Any reading of the result as showing a statistically lower mortality, and the hypothesis of a protective effect that the Discussion raises, have less support than the printed interval suggests.
Explanations considered
- A different CI method. This does not account for the numbers. Exact, mid-p, Byar, score, Jeffreys, log-Wald and Wald intervals for 2 events all have lower limits of 0.90 or less and upper limits of 7.82 or more. With 2 events, the width of any interval is set by the count, not by the choice of method.
- A different confidence level. This does not account for the numbers. The letter labels the interval "95% CI". To give 2.12–5.05 from 2 deaths, a log-Wald interval would need a confidence level of about 46%. The exact 50% interval is 1.58–6.43, still wider than the printed one.
- Different inputs (another count or another denominator). This does not account for the numbers as published. The point estimate 3.28 reproduces exactly from 2 deaths and 610.1 person-years, and 4.08% reproduces from 2 of 49, so the stated numerator and denominator are the ones the rate uses. The printed interval is centered on 3.28 (geometric mean of the limits 3.27). Its width matches about 20–23 events at that rate. The letter reports no analysis with that many events. The 2020 meeting abstract of the same study also reports 2 deaths among 49 recipients.
- Rounding. This does not account for the numbers. Over the rounding range of the printed limits (2.115–2.125, 5.045–5.055), the implied number of events stays between 20.2 and 20.6.
- A typographical error in one limit. This does not account for the numbers. Both limits are wrong in the same direction (the lower too high, the upper too low), and they are symmetric about 3.28 on the log scale. A single mistyped digit would not produce that pattern.
- A conversion or typesetting error in the archived text. This is excluded. The PMC article page and the Europe PMC full-text XML give the same sentence word for word (the string "3.28 (2.12–5.05)" occurs once in the XML), and the local archived copy agrees.
- An explanation in a supplement or in the figure. This is not available. The letter has no supplementary material. The Figure 1 legend describes the inset as a bar graph of incidence rates and does not mention intervals. The figure image could not be retrieved, so it was not checked.
Status
- Version of record. The publisher's pages could not be fetched: doi.org/10.2337/dc20-2458 redirects to diabetesjournals.org (care/article/44/4/e67/138613), which returned HTTP 403, and the publisher PDF listed in Crossref also returned 403. The final published text was read on the PMC article page (publication status ppublish) and in the Europe PMC full-text XML. Both carry the quoted sentences with identical values. Every quotation above was confirmed verbatim against the PMC-archived text with
src/show.py. The Figure 1 legend excerpt was confirmed against the same archived full text. - Supplements. None. The Europe PMC XML has no supplementary-material elements (its only graphics are Figure 1 and its thumbnail), the PMC page lists no supplementary material, and the Europe PMC supplementary-files endpoint returned 404. The letter (pages e67–e68) has no data supplement. The related ADA 2020 meeting abstract (doi:10.2337/db20-206-lb) confirms 2 deaths and n = 49 but reports no person-years, rate or CI.
- Corrections and comments. As of 2026-10-24 I found no correction, erratum, expression of concern, retraction or published comment. Crossref lists no update relations for the DOI, and PMC and Europe PMC list no correction notices. A web search for corrections or comments on the article found none. The PubPeer search API refused automated access (HTTP 403, human verification required), so PubPeer could not be checked directly.
- Sources. PMC article PMC7985423; Europe PMC full-text XML for PMC7985423; Crossref records for 10.2337/dc20-2458 and 10.2337/db20-206-lb; Europe PMC notices; web search.
Suggested correction
- Replace the interval in the Results with one computed from 2 deaths in 610.1 person-years, for example "3.28 (95% CI 0.40–11.84) per 1,000 person-years (exact Poisson)", and name the method.
- If an interval or error bars for the Miami cohort appear in the Figure 1 inset, correct them in the same way.
- Revise the comparison with the other cohorts to say that, with 2 deaths, the confidence interval for the transplant cohort includes all three comparator rates (5.31, 7.99 and 10.79 per 1,000 person-years), so the data are compatible both with lower mortality and with mortality similar to those populations.
- Qualify the hypothesis of a protective effect on mortality accordingly, in line with the letter's closing call for larger data sets.