← Back to the plain-language case
End-study hemoglobin confidence interval is nine times wider than the paper's own SDs allow
PLoS Med (2020) · doi:10.1371/journal.pmed.1003430 · PMC7707571
Summary
This randomized trial of daily vitamin B12 in 600 Nepalese infants reports an end-study difference in hemoglobin, one of its three primary outcomes, of 0.02 g/dL (95% CI −1.33 to 1.37, P = 0.978). The figure appears in the Abstract, in the Results text and in Table 3. With the group SDs (0.8 and 1.0 g/dL), group sizes (283 and 290) and equal-variance Student t test that Table 3 itself reports, the interval is −0.13 to 0.17 and P = 0.79. The printed interval is 9.07 times too wide, while the same calculation reproduces the other 22 rows of Tables 2 and 3. The paper's conclusion of no effect on hemoglobin stands and becomes more precise. But the printed interval cannot exclude effects of more than 1 g/dL in either direction, and any meta-analysis that takes it at face value gives this trial about 1/82 of its proper weight.
What the paper reports
Abstract, Methods and findings:
Furthermore, at the end of the study, the mean difference in hemoglobin concentration was 0.02 g/dL (95% CI: -1.33 to 1.37, P = 0.978), and the difference in the cognitive scaled scores was 0.16 (95% CI: -0.54 to 0.87, P = 0.648).
Results, "End points":
The mean difference in hemoglobin concentration between the groups was 0.02 g/dL (95% CI: -1.33 to 1.37, P = 0.978).
Table 3, column headers and the two hemoglobin rows (vitamin B12 group n = 283, placebo group n = 290; mean ± SD; mean difference (95% CI) (P value)):
Change from baseline … Hemoglobin (g/dL) | 1.0 ± 1.1 | 1.0 ± 1.2 | -0.02 (-0.20 to 0.17) (0.876)
End study … Hemoglobin (g/dL) | 11.6 ± 0.8 | 11.6 ± 1.0 | 0.02 (-1.33 to 1.37) (0.978)
Table 3 footer (the Table 2 footer is identical):
The mean differences, the corresponding 95% CI, and P values were calculated using Student t test assuming equal variances.
Participants and methods, "Statistical analyses":
For the other outcome variables (Bayley-III raw scores, growth, and hemoglobin concentrations), the effects of the intervention were estimated by comparing the changes from baseline to end study between the study groups. The precision of the effect estimates and corresponding P values were calculated using the Student t test assuming equal variances.
Results, first paragraph:
We were able to collect and analyze blood samples for biomarker assessments at end study from 567 children.
Discussion:
As a result, we have precise effect estimates of our primary outcomes, and thus, sufficient power to detect clinically meaningful differences between the treatment groups.
Table 1 gives baseline hemoglobin as 10.6 ± 0.96 g/dL (vitamin B12) and 10.6 ± 0.91 g/dL (placebo).
What the paper's own numbers show
Method. I used the test the paper names: a pooled-SD (equal-variance) Student t test, with sp = √(((n₁−1)s₁² + (n₂−1)s₂²)/(n₁+n₂−2)), SE = sp·√(1/n₁+1/n₂), 95% CI = d ± t₀.₉₇₅,df·SE, and two-sided P from d/SE. The SE implied by a printed interval is its width divided by 2·t₀.₉₇₅,df. I applied this to every row of Table 3 (n = 283/290, df = 571) and Table 2 (n = 283/289, df = 570), using each printed mean difference, so the other rows serve as controls for the method. I then tested rounding of the SDs, a smaller analysed sample, and a g/L-versus-g/dL unit mix-up. Every number below is printed by recompute.py.txt.
| Quantity | Location | Reported | Recomputed from the paper's numbers |
|---|---|---|---|
| End-study Hb, mean difference (95% CI), P | Table 3; Abstract; Results | 0.02 (−1.33 to 1.37), P = 0.978 | 0.02 (−0.13 to 0.17), P = 0.792 |
| End-study Hb, SE of the difference | Table 3 (derived) | 0.687 (from the printed CI) | 0.0758 (pooled SD 0.907); ratio 9.07 |
| End-study Hb, unequal-variance (Welch) SE | derived | – | 0.0756, essentially the same |
| End-study Hb, P from the printed CI | derived | P = 0.978 | 0.977: the printed CI and P fit each other |
| Pooled SD that the printed CI would need | derived | SDs 0.8 and 1.0 g/dL | 8.23 g/dL |
| Group size that the printed CI would need | derived | n = 283 and 290 | about 3.5 children per group |
| Largest half-width over SD rounding (0.75–0.85, 0.95–1.05) and n 567 or 573 | derived | 1.35 | 0.158 |
| Change in Hb, mean difference (95% CI), P | Table 3 | −0.02 (−0.20 to 0.17), P = 0.876 | −0.02 (−0.21 to 0.17), P = 0.835; SE ratio 0.98 |
| End-study Hb mean = baseline + change | Tables 1 and 3 | 11.6 | 10.6 + 1.0 = 11.6 in both groups |
| Other 7 rows of Table 3 (length, weight, z-scores) | Table 3 | CIs as printed | SE ratios 0.96–1.05 |
| 14 rows of Table 2 (Bayley-III) | Table 2 | CIs as printed | SE ratios 0.99–1.02, and 1.10 for the socio-emotional raw change |
| Inverse-variance weight, printed vs recomputed SE | derived | – | the recomputed SE gives 82 times the weight |
The method reproduces 22 of the 23 printed intervals in the two tables, to within the rounding of the SDs and mean differences. (The socio-emotional raw-score change, at 1.10, is the only other row outside 0.96–1.05. It is consistent with somewhat fewer children completing that scale, and it is not part of this finding.) The end-study hemoglobin row is off by a factor of nine, although its SDs are similar to those of the change-score row just above it, which does reproduce. Its printed P value is consistent with the printed interval, so the CI and P appear to come from the same wrong standard error.
Figure
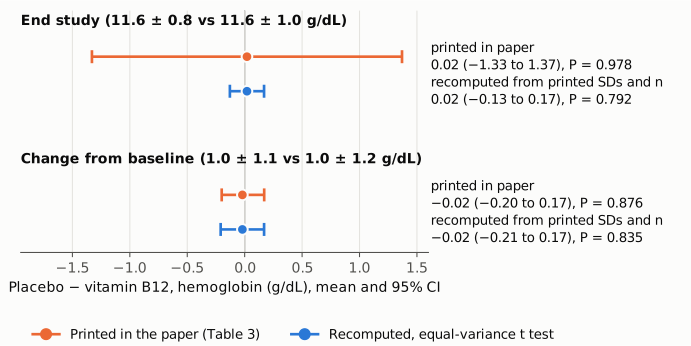
Figure 1. Mean difference in hemoglobin (placebo minus vitamin B12, g/dL) with 95% CI, for the end-study comparison (top) and the change from baseline (bottom). Orange: as printed in Table 3, the Abstract and the Results. Blue: recomputed from the group SDs and sample sizes printed in Table 3 with the equal-variance t test the table footer names. The thin vertical line marks no difference. For the change from baseline the two intervals coincide. For the end-study comparison, whose group SDs (0.8 and 1.0) are slightly smaller than the change-score SDs (1.1 and 1.2), the printed interval is nine times wider than the recomputed one.
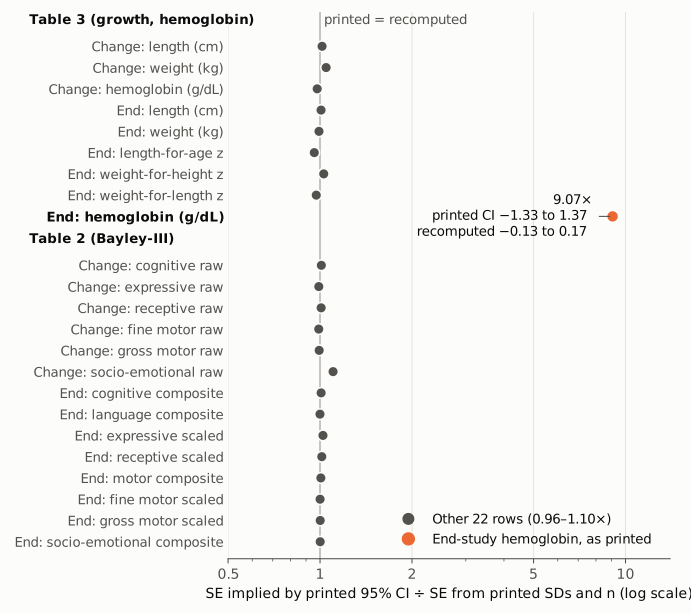
Figure 2. For each of the 23 rows of Tables 2 and 3, the standard error implied by the printed 95% CI divided by the standard error recomputed from that row's printed SDs and group sizes (log scale; the thin line at 1 marks agreement). The 22 gray points lie between 0.96 and 1.10, which shows that the method and inputs reproduce the paper's own calculations. The end-study hemoglobin row (orange) lies at 9.07.
Why it matters
Hemoglobin is one of the trial's three primary outcomes, and the wrong interval is the one the Abstract quotes. As printed, the interval runs from −1.33 to 1.37 g/dL. It therefore cannot exclude an effect of vitamin B12 on hemoglobin of more than 1 g/dL in either direction, a clinically large difference in a population where 61% to 67% of the infants were anemic at baseline (Table 1). The interval that the paper's own SDs and sample sizes give, −0.13 to 0.17 g/dL, excludes any effect larger than about 0.15 g/dL. The printed interval also undercuts the Discussion's statement that the trial produced "precise effect estimates of our primary outcomes". The corrected interval supports that statement.
The paper's conclusions do not change. The Statistical analyses section says the hemoglobin effect was estimated from change scores, and that row (−0.02, −0.20 to 0.17) is correct. The Abstract's conclusion that supplementation "did not affect neurodevelopment, growth, or hemoglobin concentration" stands, and its policy statement ("Our results do not support widespread vitamin B12 supplementation in marginalized infants from low-income countries") is, for hemoglobin, strengthened rather than weakened by the correct interval.
The readers most likely to be misled are meta-analysts and guideline reviewers who extract the end-study mean difference and its CI from the Abstract or Table 3. The SE they derive (0.687 g/dL) is nine times too large, which gives this 573-child trial about 1/82 of its proper inverse-variance weight. The trial, one of the larger infant B12 trials, would then contribute almost nothing to a pooled estimate of the effect of B12 on hemoglobin. A reader who instead recomputes the SE from the SDs gets a different interval from the one printed, with no way to tell which is right. Crossref lists 37 citing works.
A separate, minor point: the Abstract and the Results both say "Children in both groups grew on an average 12.5 cm (SD: 1.8), and the mean difference was 0.20 cm (95% CI: -0.23 to 0.63, P = 0.354)." In Table 3, 0.20 (−0.23 to 0.63) (0.354) is the end-study length row. The change-in-length row, which the sentence describes, is 0.09 (−0.21 to 0.39) (0.574). Both are null, so the conclusion is unaffected.
Explanations considered
- A different test from the one stated. This does not account for the numbers. Both table footers and the Statistical analyses section name the equal-variance Student t test. The unequal-variance (Welch) SE is 0.0756 against a pooled 0.0758, so the choice of variance assumption does not matter here. The same pooled test reproduces the other 22 rows of Tables 2 and 3.
- Rounding of the printed SDs or mean difference. This does not account for the numbers. Letting the SDs range over 0.75–0.85 and 0.95–1.05 gives a largest half-width of 0.158 g/dL, against the printed 1.35. Rounding of the means (both 11.6) moves the centre of the interval, not its width.
- Fewer children with end-study blood samples. This does not account for the numbers. The Results give 567 children with end-study blood samples, against 573 in the Table 3 header; the half-width becomes 0.158 at most. Even 50 children per group would give 0.379. The printed width would need about 3.5 children per group at the printed SDs.
- A different population or time point. This is unlikely. The row is labelled "End study", and its means are consistent with the rest of the paper: baseline 10.6 (Table 1) plus change 1.0 (Table 3) equals the end-study 11.6 in both groups.
- SDs in g/L (ten times larger) used for the SE while the interval is printed in g/dL. This comes close but does not reproduce the numbers. SDs of 8 and 10 g/L give a half-width of 1.488, and the rounding range 7.5–8.5 and 9.5–10.5 g/L gives 1.41 to 1.57, all above the printed 1.35. The observed ratio is 9.07, not 10. I could not identify a calculation from the printed inputs that gives exactly 1.35; without the trial data, the source of the wrong standard error cannot be determined.
- A conversion or typesetting error in the archived text. This is excluded. The PLOS Medicine article page, the publisher's PDF (Abstract on p. 2; Results and Table 3 on p. 9), the publisher's article XML, the PMC page and the Europe PMC full-text XML all print −1.33 to 1.37 and P = 0.978, with proper minus signs and aligned table cells.
- The value is explained in a supplement. This is excluded; see Status.
Status
- Version of record. The values above are identical in the PLOS Medicine article page (reached from the DOI), the publisher's 15-page PDF, the publisher's article XML, the PMC-archived text and the Europe PMC full-text XML. Every quotation above was confirmed verbatim against the PMC-archived text with
src/show.py(the PMC text renders the minus signs as hyphens). - Supplements. The article lists 10 supporting files: S1 Fig (Bayley subscales by subgroup), S2 Fig (described as growth and hemoglobin across subgroups, but it shows only height-for-age and weight-for-age Z-score forest plots), S1 Table (B12 status markers), S2 Table (compliance), S3 Table (adverse events), S1 and S2 Text (protocols), S3 and S4 Text (analysis plans) and the CONSORT checklist. None reports the end-study hemoglobin comparison. The data are available only on request with ethics approval, so the interval cannot be recomputed from individual data. The published peer-review history does not raise the hemoglobin interval.
- Corrections and comments. As of 2026-10-24 I found no correction, erratum, expression of concern or retraction. Crossref lists no update relations for the DOI, PMC and Europe PMC list no notices, and the PLOS Medicine article page shows no reader comments and no linked correction. A web search for corrections or comments found none. The PubPeer API and site refused automated access (Cloudflare challenge, HTTP 403), and a web search found no PubPeer thread for the DOI, so PubPeer could not be checked directly.
- Sources. PMC article PMC7707571; Europe PMC full-text XML; the PLOS Medicine article page, PDF, XML, supporting files and comments page for doi:10.1371/journal.pmed.1003430; Crossref; trial registration NCT02272842 (cited in the paper).
Suggested correction
- Recompute the end-study hemoglobin comparison from the trial data and correct the 95% CI and P value in Table 3, in the Abstract and in the Results "End points" paragraph. From the printed SDs and group sizes these are about 0.02 g/dL (95% CI −0.13 to 0.17, P = 0.79).
- Because the Statistical analyses section defines the hemoglobin effect as the change from baseline, consider quoting the change-score result (−0.02 g/dL, 95% CI −0.20 to 0.17, P = 0.876) in the Abstract and Results, or say which of the two is the primary estimate.
- Minor: in the Abstract and Results sentence on growth, either report the change-in-length difference (0.09 cm, 95% CI −0.21 to 0.39, P = 0.574) or state that 0.20 cm is the end-study difference in length.