← Back to the plain-language case
Re-positive rate's 95% confidence interval excludes its own point estimate in abstract and Results
Nat Commun (2020) · doi:10.1038/s41467-020-19802-w · PMC7679396
Summary
The paper reports that 107 of 34,424 recovered COVID-19 patients tested positive again in Wuhan's city-wide screening, a re-positive rate of 0.31%, with a 95% confidence interval of 0.423–0.574%. The interval lies entirely above the point estimate, which none of the standard two-sided intervals (exact, score, Wald, Agresti–Coull, Jeffreys) does for 107/34,424. Applied to 107/34,424, the paper's stated method (Clopper–Pearson exact) gives 0.255–0.375%. The same method reproduces exactly all 27 other intervals in Tables 1–2 and the antibody text, and also the two single- and mixed-testing intervals once their unprinted counts are inferred. The point estimate and the paper's conclusions are unaffected, but the wrong interval is printed in the abstract. Anyone who extracts it, for example for a meta-analysis of re-positivity after recovery, gets a range whose lower bound lies above the correct upper bound, centred near 0.50% instead of 0.31%.
What the paper reports
Abstract:
107 of 34,424 previously recovered COVID-19 patients tested positive again (re-positive rate 0.31%, 95% CI 0.423–0.574%).
Results, second paragraph (screening results):
Of the 34,424 participants with a history of COVID-19, 107 tested positive again, giving a repositive rate of 0.310% (95% CI 0.423–0.574%).
Results, first paragraph (the denominators):
Of the 9899,828 participants, 9,865,404 had no previous diagnosis of COVID-19, and 34,424 were recovered COVID-19 patients.
Methods, "Statistical analysis" (the stated method, which covers both the asymptomatic and the re-positive rates):
Detection rate of asymptomatic positive or repositive cases was calculated by dividing the number of individuals with a positive result of nucleic acid testing by the number of participants tested. Because of extremely low detection rates, we calculated 95% confidence intervals of estimated proportions using Pearson–Klopper exact method, implemented through R package “binom” version 1.1-1…
Discussion, third paragraph (the statement that rests on this estimate):
There was a low repositive rate in recovered COVID-19 patients in Wuhan.
What the paper's own numbers show
Method. I took the count (107) and denominator (34,424) printed in the abstract and the Results and computed the proportion and its two-sided 95% Clopper–Pearson interval from beta quantiles. This is the interval that R's binom package returns for method = "exact". For comparison I also computed the Wilson, Wald, Agresti–Coull, Jeffreys and Poisson-exact intervals. To confirm that I was applying the paper's method the way the authors did, I applied the same calculation to every other interval in the paper whose count and denominator are printed: the 22 rows of Table 1 (asymptomatic positives per 10,000 by sex, age and district), the four rows of Table 2, the IgG-positive proportion in the Results (antibody results, % of 300) and the asymptomatic rate in the second paragraph of the Results. The paper has two further intervals, the asymptomatic rates for single and mixed testing in the fourth paragraph of the Results, for which only the share of samples (76.7% and 23.3%) is printed, not the counts. For these I took the denominators as 76.7% and 23.3% of 9,899,828 and searched for the counts whose exact interval matches the printed one. Finally I searched for the count, denominator and confidence level that would produce the published interval, and compared the counts in the publisher's Source Data workbook with the printed Tables 1 and 2. Every number below is printed by recompute.py.txt.
| Quantity | Location | Reported | Recomputed from the paper's numbers |
|---|---|---|---|
| Re-positive rate, 107/34,424 | Abstract; Results para 2 | 0.31% (abstract), 0.310% (Results) | 0.3108%, which rounds to 0.311%; the Results' 0.310% is the truncated value, a negligible difference |
| 95% CI, Clopper–Pearson (stated method) | Abstract; Results para 2 | 0.423–0.574% | 0.255–0.375% (0.2548–0.3755%) |
| 95% CI, other standard methods | — | — | Wilson 0.257–0.375%; Wald 0.252–0.370%; Agresti–Coull 0.257–0.376%; Jeffreys 0.256–0.374%; Poisson exact 0.255–0.376% |
| Does the reported CI contain the point estimate? | — | — | No; 0.311% is below the reported lower bound of 0.423% |
| Gap between the intervals | — | — | Reported lower bound 0.423% exceeds the recomputed upper bound 0.375% by 0.048 points; the intervals do not overlap |
| Midpoint of the interval | — | 0.4985% (midpoint of 0.423–0.574%) | 0.311%; the reported midpoint is 1.60 times the point estimate |
| Width / implied standard error | — | 0.151 points; implied SE 0.0385 points | 0.121 points; binomial SE 0.0300 points |
| Reported bound ÷ recomputed bound | — | — | lower 1.66, upper 1.53 |
| Count x out of 34,424 whose exact CI rounds to 0.423–0.574% | reverse search | — | only x = 170 (0.4225–0.5737%; rate 0.494%) |
| Denominator n for which 107/n gives 0.423–0.574% | reverse search, n = 10,000–60,000 | — | none; the closest (n = 22,514) gives 0.390–0.574% |
| Other confidence levels for 107/34,424 | reverse search | — | 90%: 0.263–0.365%; 99%: 0.239–0.397%; 99.9%: 0.221–0.422%. Even the 99.9% upper bound is below 0.423% |
| Table 1, 22 rates per 10,000 with CIs | Table 1 | e.g. Total 0.303 (0.270–0.339); Male 0.256 (0.214–0.303); Wuchang 0.807 (0.633–1.015); East Lake Scenic 0.000 (0.000–0.430) | all 22 reproduce exactly with Clopper–Pearson |
| Antibody proportions, % of 300 | Table 2; Results para 9 | 53.7 (47.8–59.4); 36.7 (31.2–42.4); 9.7 (6.6–13.6); 0.0 (0.0–1.2); IgG+ 63.3 (57.6–68.8) | all 5 reproduce exactly from the printed counts (161, 110, 29, 0; IgG+ 190) |
| Asymptomatic rates, single and mixed testing (counts not printed) | Results para 4 | single 0.321 (0.282–0.364)/10,000; mixed 0.243 (0.183–0.315)/10,000 | with denominators of about 7,593,168 (76.7% of 9,899,828) and 2,306,660 (23.3%), only the counts 244 and 56 reproduce the printed rate and interval, and 244 + 56 = 300, the total of asymptomatic positives. Both intervals are consistent with Clopper–Pearson |
| Asymptomatic rate, denominator 9,865,404 | Results para 2 ("participants without a history of COVID-19") | 0.303 (0.270–0.339)/10,000 | 0.304 (0.271–0.341)/10,000; the printed figures match 300/9,899,828 (all participants), as in Table 1 |
| Denominators | Results para 1; Table 1; Table 2 | 9,865,404 + 34,424; total 9,899,828 | sum 9,899,828; sex, age and district totals also sum to 9,899,828 and district cases to 300; printed antibody counts sum to 300, with 161 + 29 = 190 IgG-positive |
| Antibody counts in the publisher's Source Data workbook | Source Data, sheet "Raw data from Table 2" | printed Table 2: 161, 110, 29, 0; Results: 190 IgG-positive | the sheet gives 157, 110, 28, 5 (also summing to 300), hence 157 + 28 = 185 IgG-positive, 61.7% (55.9–67.2%) instead of 63.3% (57.6–68.8%). The sheet "Raw data from Table 1" matches the printed Table 1 in all 21 rows |
The stated method reproduces every other interval in Tables 1–2 and the antibody text to the last printed digit, and the two single/mixed intervals are reproduced by inferred counts that add up to the paper's 300 asymptomatic positives, so the method itself is not in doubt. The count, the denominator and the point estimate are mutually consistent. Only the re-positive interval cannot be obtained from the printed inputs, under the stated method or any other standard one.
There is one minor, separate observation. The Results attach the asymptomatic rate to the 9,865,404 participants without a COVID-19 history, but the printed rate and interval are those for all 9,899,828 participants (Table 1, Total). The difference is in the third decimal and changes nothing. A second separate observation concerns the antibody counts: the publisher's Source Data workbook gives different Table 2 counts from the printed table (row above). This does not bear on the re-positive interval.
Figure
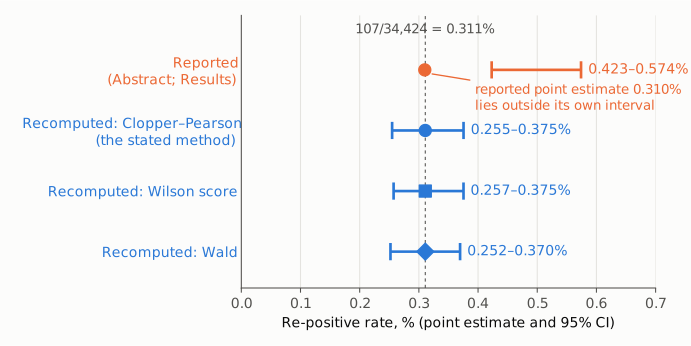
Figure 1. The re-positive rate among recovered patients on one percentage axis, starting at zero. The orange row is the reported point estimate and 95% CI (identical in the Abstract and the Results). The blue rows are intervals recomputed from the paper's own count and denominator, 107/34,424: Clopper–Pearson (the method the Methods name), Wilson score and Wald. The dashed vertical line marks the point estimate, 0.311%. Every recomputed interval contains it and spans about 0.25–0.38%. The reported interval, 0.423–0.574%, lies wholly to the right of its own point estimate and does not overlap any of the recomputed intervals.
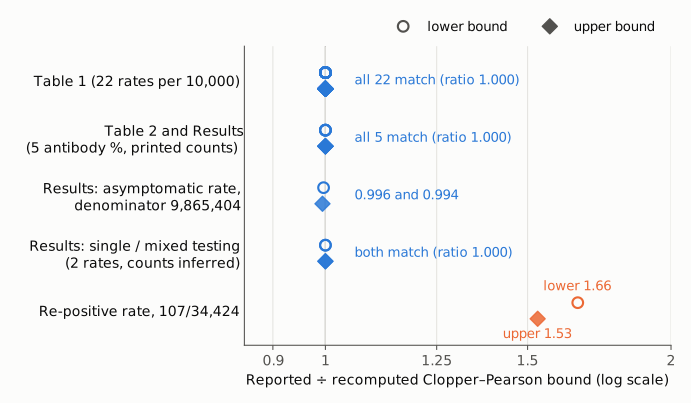
Figure 2. Each reported confidence bound in the paper, divided by the Clopper–Pearson bound recomputed from that row's count and denominator and rounded to the same number of decimals (log scale; 1 means identical). The counts are printed in the paper except for the single- and mixed-testing rates, where they are inferred (244 and 56; see the table). Within each row, hollow circles (lower bounds) are drawn just above the row and filled diamonds (upper bounds) just below it, so both stay visible when their ratios are equal; lower bounds of zero are omitted. All 22 Table 1 intervals, all 5 antibody intervals (from the printed Table 2 counts) and both single/mixed intervals give a ratio of exactly 1.000. The Results-text asymptomatic rate, checked against the 9,865,404 denominator the text names, gives 0.996 and 0.994 (it matches the 9,899,828 total exactly). The re-positive interval (orange) gives 1.66 for the lower bound and 1.53 for the upper bound. It is the only interval that the stated method does not reproduce with any of the paper's denominators.
Why it matters
- The interval is in the abstract. The abstract is the part of the paper most often read, indexed and quoted. As printed, it puts the plausible range of re-positivity at 0.42–0.57%. The correct range is 0.26–0.38%, and the two do not overlap.
- Evidence synthesis. Systematic reviews and meta-analyses of SARS-CoV-2 re-positivity or re-detection after recovery commonly extract a proportion with its CI, or back-calculate a standard error from the CI. Using the published interval would place this study's estimate near 0.50% (the interval midpoint) instead of 0.31%, with a standard error about 1.28 times too large (0.0385 vs 0.0300 percentage points). The study's large denominator would still give it notable weight, so the shifted centre (about 0.50%) would pull a pooled estimate upward, while its inverse-variance weight would be about 0.61 of the correct weight, that is, understated by about 40%.
- Internal coherence. A reader who sees an interval that excludes its own estimate cannot tell from the paper which number is wrong: the count, the denominator, the point estimate or the interval. The arithmetic shows that the count, denominator and point estimate agree with one another and that the interval is the outlier.
- What is not affected. The headline result, the asymptomatic detection rate of 0.303 per 10,000 (0.270–0.339), reproduces exactly, as do all of Table 1 and, with inferred counts, the single- and mixed-testing rates. The Table 2 intervals and the 63.3% IgG-positive figure reproduce exactly from the printed counts; the Source Data workbook's different counts (157, 110, 28, 5) would give 185 IgG-positive (61.7%), which does not change the paper's reading that most asymptomatic positives had antibodies. The Discussion's statement that the re-positive rate was low holds with the correct interval, whose upper bound (0.375%) is in fact lower than the published lower bound. The conclusion that post-lockdown prevalence in Wuhan was very low is unchanged.
Explanations considered
- A different interval method. This does not account for the numbers. Clopper–Pearson, Wilson, Wald, Agresti–Coull, Jeffreys and Poisson-exact intervals for 107/34,424 all lie within 0.252–0.376%. For these data the standard two-sided intervals (exact, score, Wald, Agresti–Coull, Jeffreys, Poisson exact) all contain the sample proportion, so none of the standard methods gives an interval wholly above 0.311%.
- A different confidence level. This does not account for the numbers. Changing the level changes the width, not the centre: the 90%, 99% and 99.9% exact intervals are 0.263–0.365%, 0.239–0.397% and 0.221–0.422%, all of which contain 0.311%.
- A different denominator. This does not account for the numbers. No denominator between 10,000 and 60,000 gives 107/n an exact interval that rounds to 0.423–0.574%. A smaller denominator would also change the point estimate, which the paper prints consistently as 0.31%/0.310%.
- A different count. Arithmetically, the exact 95% interval for 170/34,424 (0.494%) is 0.4225–0.5737%, which rounds to the published bounds, and no other count does. The number 170 does not appear in the archived text, and the published material does not show where the interval came from. The match is an arithmetic observation only.
- A conversion or typesetting error. This is excluded. The publisher's HTML (published 20 November 2020), the PMC archive and the Europe PMC full-text XML all carry the same interval in both the Abstract and the Results. The medRxiv preprint (10.1101/2020.06.29.20142554, version 1, 30 June 2020) already reported a relapse rate of 0.310% with the same 95% CI of 0.423–0.574%, so the interval was present before peer review.
- A different definition of "re-positive" or a subgroup. This does not account for the numbers. The Methods define re-positive cases as recovered patients who tested positive again in the screening. The abstract and Results tie the interval directly to "107 of 34,424", and the paper reports no other re-positive count or subgroup.
Status
- Version of record. The publisher's page (nature.com/articles/s41467-020-19802-w, published 20 November 2020) has the same Abstract and Results text as the PMC archive. Its change history has one entry, dated 17 December 2020: the Peer Review file had been omitted and was added. That update did not change the interval. Every quote above was confirmed verbatim against the PMC-archived text with
src/show.py. - Supplements. All four electronic supplementary files were checked. The Supplementary Information covers protocols, case definitions and the Ct values of asymptomatic cases, and has nothing on re-positive cases. The Peer Review File does not mention the re-positive interval. The Source Data workbook covers Tables 1–2 and Figures 1–3 but has no counts of recovered or re-positive patients. Its Table 1 sheet matches the printed Table 1, but its Table 2 sheet gives antibody counts of 157 (IgM−/IgG+), 110 (IgM−/IgG−), 28 (IgM+/IgG+) and 5 (IgM+/IgG−), which differ from the printed 161, 110, 29 and 0 and imply 185 IgG-positive cases rather than the 190 in the Results, although both sets sum to 300. The re-positive interval is unaffected. The Reporting Summary is a standard form. None of the supplements resolves the discrepancy.
- Corrections and comments. As of 2026-10-23 I found no correction, erratum, retraction or expression of concern. Crossref lists no update relations for the DOI (its relation field links only the medRxiv preprint), and PMC and Europe PMC list no correction notices. The publisher's page shows no correction notice. A reader comment on the publisher's page dated 29 December 2020 pointed out that the point estimate lies outside the confidence interval; commenting is now closed, and no reply or correction followed in the record. The PubPeer API refused automated access (HTTP 403), and a web search found no PubPeer thread for the article.
- Sources. PMC article PMC7679396; publisher page https://www.nature.com/articles/s41467-020-19802-w and its electronic supplementary material; Europe PMC full-text XML; medRxiv 10.1101/2020.06.29.20142554 v1; Crossref; Europe PMC; PubPeer.
Suggested correction
- Replace the re-positive interval in the Abstract and in the second paragraph of the Results. If 107 of 34,424 is correct, the text would read "re-positive rate 0.31%, 95% CI 0.25–0.38%" in the Abstract and "repositive rate of 0.311% (95% CI 0.255–0.375%)" in the Results, using the Clopper–Pearson method stated in the Methods. (107/34,424 = 0.3108%; the printed 0.310% is the truncated value, and 0.311% is the rounded one.) If the count or denominator is the figure in error instead, correct it and recompute both the rate and the interval.
- Minor: in the second paragraph of the Results, either give the asymptomatic rate for the 9,865,404 participants without a COVID-19 history (0.304 per 10,000, 95% CI 0.271–0.341), or state that 0.303 (0.270–0.339) refers to all 9,899,828 participants, as in Table 1. Separately, "9899,828" in the first paragraph of the Results should read "9,899,828".
- Minor and separate: the antibody counts in the Source Data workbook (157, 110, 28, 5) differ from the printed Table 2 (161, 110, 29, 0) and from the 190 IgG-positive cases in the Results. Whichever set is in error should be corrected so that the Source Data and the printed table agree; if the Source Data counts are the correct ones, Table 2 and the 63.3% (57.6–68.8%) IgG-positive figure in the Results would change, the latter to 61.7% (55.9–67.2%).