← Back to the plain-language case
Interim primary result is called significant, but p = 0.039 exceeds the trial's stated 0.0054 threshold
Cell (2020) · doi:10.1016/j.cell.2020.08.051 · PMC7462457
Summary
The paper reports an interim analysis of the ACTIVATE trial, which randomized hospitalized elderly patients to BCG or placebo. Its Abstract and Results say that BCG "significantly increased the time to first infection", and the Abstract concludes that BCG "can protect the elderly against infections". The STAR Methods and the supplementary statistical plan set the significance level for this interim analysis at α = 0.0054 (O'Brien-Fleming adjustment), but the primary-outcome hazard ratio is 0.55 (95% CI 0.31–0.97) with p = 0.039, about seven times that level. At the stated interim level the interval is about 0.24–1.24, which includes 1. The stepwise Cox result and the Abstract's viral-respiratory result also fail to meet the threshold. The paper's headline efficacy claim is therefore not supported under the significance level the paper itself states for the interim analysis, and the paper does not say so.
What the paper reports
Abstract:
At interim analysis, BCG vaccination significantly increased the time to first infection (median 16 weeks compared to 11 weeks after placebo). The incidence of new infections was 42.3% (95% CIs 31.9%–53.4%) after placebo vaccination and 25.0% (95% CIs 16.4%–36.1%) after BCG vaccination; most of the protection was against respiratory tract infections of probable viral origin (hazard ratio 0.21, p = 0.013).
Data show that BCG vaccination is safe and can protect the elderly against infections.
Introduction, paragraph 4:
Results of this interim analysis clearly showed protection of the elderly from new infections with major effect on the prevention of respiratory infections.
Results, "BCG Vaccination Decreases the Incidence of New Infections with a Major…", paragraph 1:
Regarding the primary endpoint of the study, BCG vaccination significantly increased the time to first infection: median 16 weeks after BCG vaccine compared to 11 weeks after placebo administration. The incidence of a new infection during the 12-month period of follow-up after vaccination was also significantly decreased; the statistically significant hazard ratio (HR) of 0.55 corresponds to 45% reduction in the risk of a new infection in the BCG group compared to the placebo group (Figure 2 A).
Same section, paragraph 3:
Stepwise Cox regression analysis showed that BCG vaccination was an independent protective factor from the incidence of new infection until month 12 (HR 0.56; 95% CI, 0.32–0.99; p = 0.048) (Table 3 ).
Table 2 ("Primary and Secondary Study Outcomes"), rows 1 and 2 (columns: placebo N = 78, BCG N = 72, HR (95% CI), p):
Incidence at least one new infection until month 12, no. (%)a | 33 (42.3) | 18 (25.0) | 0.55 (0.31–0.97) | 0.039
Respiratory infections of probable viral origin necessitating medical treatment, no. (%) | 14 (17.9) | 3 (4.2) | 0.21 (0.06–0.72) | 0.013
STAR Methods, "Quantification and Statistical Analysis", paragraph 4 (repeated with the same values and only minor wording differences in the supplementary Data S1/Methods S1, "Statistical plan for interim analysis of the ACTIVATE trial"):
The interim analysis included only patients with completed 12-month of follow-up. In order to preserve the overall Type I error rate at 5%, an adjustment of the level of significance of the interim and final analyses was done by O’Brien-Fleming strict alpha adjustment. This adjustment provides significance a = 0.0054 at interim and a = 0.0492 at final (DeMets and Lan, 1994). The purpose of using this seemingly unattainable level of significance at interim analysis was to allow the study to conclude, at the same time providing evidence that the required level of significance will be attained at the final stage.
STAR Methods, same section, later paragraph:
All p values were two-sided and any p value < 0.05 was considered as statistically significant.
Discussion, paragraphs 2 and 5:
In line with this, the incidence of infection in the ACTIVATE trial was significantly lower in the elderly individuals vaccinated with BCG, compared to the non-vaccinated participants.
It needs, however, to be mentioned that despite the small sample size significant differences were found.
What the paper's own numbers show
Method. For a Cox model a 95% Wald interval is exp(b ± 1.96·SE), where b = ln HR. The standard error is therefore SE = (ln upper − ln lower)/(2 × 1.96), the Wald statistic is z = ln HR / SE, and the two-sided p is 2·(1 − Φ(|z|)). An interval at the stated interim level α = 0.0054 uses the critical value z = 2.782 (a 99.46% interval). I applied this to every hazard ratio the paper uses for its efficacy claims, checked the crude counts with 2×2 tests, recomputed O'Brien-Fleming-type interim levels (Lan-DeMets spending, two looks, overall two-sided α = 0.05) for the stated and the actual information fractions, and solved for the information fraction at which the stated pair of levels (0.0054 interim, 0.0492 final) keeps the overall α at 0.05 (bivariate-normal probabilities, checked by direct numerical integration). Every number below is printed by recompute.py.txt.
| Quantity | Location | Reported | Recomputed from the paper's numbers |
|---|---|---|---|
| Primary outcome, any new infection to month 12 | Table 2 row 1; Results; Fig. 2A | HR 0.55 (0.31–0.97), p = 0.039, "statistically significant" | SE 0.291, z = −2.05, p = 0.040 (consistent); 99.46% CI 0.24–1.24, includes 1 |
| Primary p against the stated interim level | Table 2; STAR Methods | p = 0.039; interim α = 0.0054 | 0.039 > 0.0054 (7.2 times); one-sided p = 0.020, also above |
| Primary p, rounding range | derived | HR 0.55, CI 0.31–0.97 | p = 0.034–0.047 over all rounding of HR and limits |
| Same HR and CI in Table 3 (univariate) | Table 3 | p = 0.035 | also above 0.0054 (Table 2 gives 0.039 for the identical estimate) |
| Stepwise (multivariate) Cox, BCG | Results; Table 3 | HR 0.56 (0.32–0.99), p = 0.048, "independent protective factor" | p = 0.044; 99.46% CI 0.25–1.25, includes 1 |
| Respiratory infections of probable viral origin | Abstract; Table 2 row 2 | HR 0.21 (0.06–0.72), p = 0.013 | p = 0.014; 99.46% CI 0.04–1.23, includes 1 |
| All respiratory infections | Table 2 row 5 | HR 0.25 (0.10–0.60), p = 0.002 | p = 0.0024; 99.46% CI 0.07–0.89, excludes 1 (meets the threshold) |
| Patient-infections per year | Table 2 | p = 0.003 | below 0.0054 (no HR or CI to recompute) |
| Crude 2×2, 33/78 vs 18/72 | Table 2 row 1 counts | 42.3% vs 25.0% | Wilson 95% CIs 32.0–53.4% and 16.4–36.1% (match within 0.1 point); χ² p = 0.025, Yates p = 0.039, Fisher p = 0.038, all above 0.0054 |
| Sensitivity analysis, all 198 patients | Table S2 | HR 0.59 (0.36–0.95), p = 0.029 | p = 0.033; 99.46% CI 0.30–1.17, includes 1 |
| Interim level 0.0054 alone | STAR Methods; Data S1 | α = 0.0054 interim | Matches an O'Brien-Fleming-type boundary at about half the information: Lan-DeMets 0.0056, classical 0.0052 at t = 0.5 |
| Stated pair 0.0054 interim / 0.0492 final | STAR Methods; Data S1 | α = 0.0054 interim, 0.0492 final (t not stated) | Final level that keeps overall α at 0.05 after an interim look at exactly 0.0054: 0.0479 at t = 0.5, 0.0485 at t = 0.6, 0.0492 at t = 0.70, 0.0495 at t = 0.75–0.76. The stated pair is consistent at t = 0.70 (0.69–0.71 allowing for rounding of 0.0492), close to the look actually taken. An O'Brien-Fleming-type interim level at t = 0.70 would be about 0.02 (Lan-DeMets 0.019, classical 0.017), so 0.0054 is stricter than O'Brien-Fleming at that point |
| Interim level at the actual fraction of patients | Results (150 of 198) | not reported | t = 150/198 = 0.758: Lan-DeMets interim α = 0.024 (classical 0.021); p = 0.039 still above |
| Interim level at the actual fraction of events | Table 2; Table S2 | not reported | 51 interim events of at least 68 (41 + 27 in all 198 at the same lock): t ≤ 0.75, α ≤ 0.024 |
| Information fraction at which the interim level would reach 0.039 | derived | n/a | t = 0.90 |
Of the results the paper uses to support efficacy, only "all respiratory infections" (p = 0.002) and patient-infections per year (p = 0.003) meet the interim level the paper states. The primary outcome, the adjusted Cox model, and the viral-respiratory result cited in the Abstract do not. Recalculating the threshold for the fraction of patients or events actually analysed does not change this. The paper's numbers are internally consistent. The problem lies in the verdict drawn from them, not in the arithmetic.
Figure
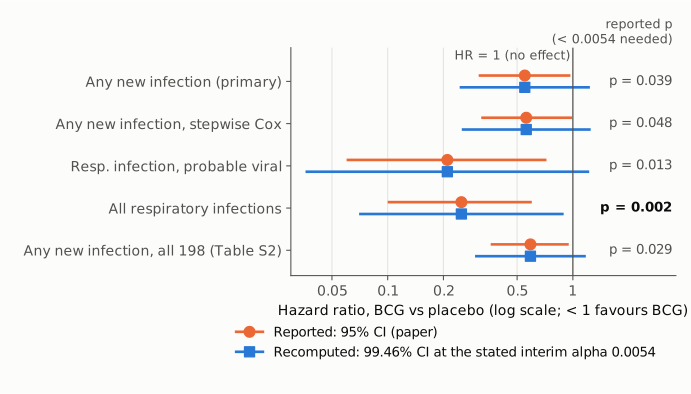
Figure 1. Hazard ratios (BCG vs placebo, log scale) for the five efficacy results the paper relies on. For each one, the orange circle and line show the hazard ratio and 95% CI as printed in Table 2, Table 3 or Table S2. The blue square and line show the same estimate with the 99.46% interval that corresponds to the interim significance level α = 0.0054 stated in the STAR Methods, computed from the printed CI. The vertical line, labelled in the figure, marks HR = 1, no effect. The p value printed by the paper is given at the right, in bold where it is below 0.0054. Under the paper's own interim rule, the intervals for the primary outcome, the stepwise Cox model, the viral-respiratory endpoint cited in the Abstract, and the full-cohort sensitivity analysis all include 1. Only "all respiratory infections" excludes it.
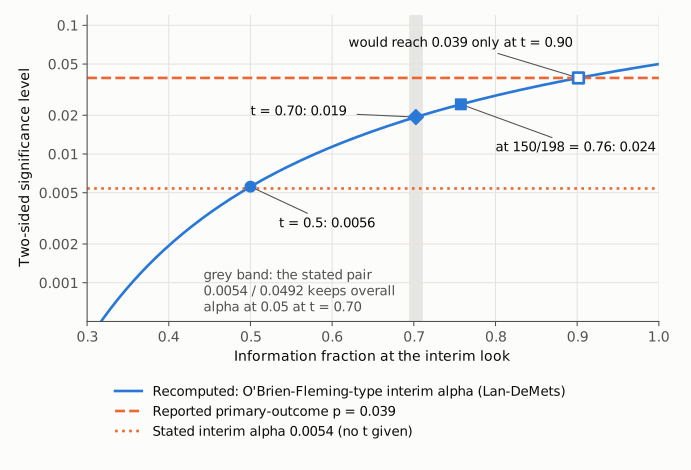
Figure 2. The blue curve is the recomputed two-sided nominal significance level for an interim look under Lan-DeMets O'Brien-Fleming-type spending (overall α = 0.05), as a function of the information fraction at that look. The orange dotted line is the paper's stated interim level, 0.0054 (the paper does not state the information fraction it assumed); the curve crosses it near t = 0.5 (0.0056 there, blue circle). The grey band (t = 0.69–0.71) is where the stated pair of levels, 0.0054 interim and 0.0492 final, keeps the overall α at exactly 0.05; there the O'Brien-Fleming-type level would be 0.019 (blue diamond), so 0.0054 is the stricter of the two. The orange dashed line is the reported primary-outcome p = 0.039. The filled blue square is the level recomputed for the fraction of patients actually analysed (150 of 198, t = 0.76): 0.024. The open blue square is where the curve reaches 0.039, at t = 0.90. Whichever reading of the stated levels is taken, and even if the threshold is recalculated for the interim analysis as actually performed, the primary result does not meet it. (For a time-to-event endpoint, information is measured in events. The event fraction is at most 51/68 = 0.75, which gives a level of at most 0.024.)
Why it matters
The trial is the paper's only efficacy evidence. Its primary endpoint is the time to first infection, and the paper's central claim, stated in the Abstract, Introduction, Results and Discussion, is that BCG significantly reduced infections. The Methods say that, to keep the overall type I error at 5%, the interim analysis would be judged at α = 0.0054. The primary result (p = 0.039) does not meet that level, and neither does the adjusted Cox analysis (p = 0.048). The Abstract's main secondary figure, protection against respiratory infections of probable viral origin (HR 0.21, p = 0.013), does not meet it either. Read against the paper's own stated interim level, the interim analysis shows a favourable point estimate (HR 0.55) that is compatible with no effect at that level (99.46% CI 0.24–1.24). It does not show a statistically significant effect. The Abstract's conclusion that the data "show that BCG vaccination … can protect the elderly against infections" is therefore stated with more certainty than the paper's stated interim level allows. The paper gives the context of the interim analysis: the Introduction says it was prompted by "the pressure rising from the need of protection of the elderly" during the pandemic; Discussion paragraph 3 says "The reason for this interim analysis that has been approved by National Ethics Committee and by the National Organization for Medicines of Greece was the emergence of the COVID-19 pandemic and the initiation of several major studies on the effect of BCG on the infection with SARS-CoV-2"; and the STAR Methods say the sponsor's initiative for the analysis was submitted to those bodies on 14 April 2020, before the database lock on 21 April 2020. It does not say when the 0.0054 level itself was set, and the point does not depend on that: the paper states 0.0054 as the interim level and then reports results that do not meet it as significant.
The paper was published in September 2020, early in the COVID-19 pandemic. Its Introduction and Discussion place the result in the context of BCG trials against SARS-CoV-2, and press coverage reported it as showing that BCG protects elderly people against respiratory infections (for example News-Medical, 1 September 2020, "BCG vaccine offers protection for elderly people against respiratory infections"; Drug Topics, 9 October 2020, "Study: BCG Vaccine Protects Elderly Against Respiratory Infections"). The News-Medical story reports the infection rates but does not mention the interim significance level. Readers of the Abstract have no way to tell that the headline result missed the trial's own interim threshold.
Two results are not affected. "All respiratory infections" (HR 0.25, p = 0.002) and patient-infections per year (p = 0.003) meet the 0.0054 level. Both are secondary endpoints, and the paper does not designate either as a confirmatory test. The safety findings are also unaffected. ClinicalTrials.gov lists the trial (NCT03296423) as completed in November 2020, with no results posted. I did not find a published final analysis that would show whether the final threshold (0.0492) was met.
Explanations considered
- The paper's general rule "any p value < 0.05 was considered as statistically significant". This explains the wording but does not resolve the conflict. It is a general statement in a short general paragraph near the end of the section, after the cytokine analyses. The interim-specific paragraph, and the supplementary statistical plan, state that the interim analysis is judged at 0.0054 "in order to preserve the overall Type I error rate at 5%". Judging the interim analysis at 0.05 discards that adjustment, and the paper nowhere says the adjustment was dropped.
- The "seemingly unattainable" sentence means the 0.0054 level was never intended as the decision rule. This does not account for the numbers. The sentence says the strict level was used "to allow the study to conclude" while "providing evidence that the required level of significance will be attained at the final stage". Whatever its intended meaning, it does not state that the primary endpoint met the interim level, and the Abstract and Results still call the result significant without qualification.
- The 0.0054 level was computed for a different information fraction, or is not a standard O'Brien-Fleming boundary. This does not change the conclusion. Two readings of the stated levels fit the numbers. Taken alone, 0.0054 matches an O'Brien-Fleming-type boundary at about half the information (Lan-DeMets 0.0056, classical 0.0052 at t = 0.5). Taken as a pair, 0.0054 interim and 0.0492 final keep the overall α at exactly 0.05 for a single interim look at t = 0.70 (0.69–0.71 allowing for rounding of 0.0492), close to the look actually taken; at that fraction an O'Brien-Fleming-type boundary would be about 0.02 (Lan-DeMets 0.019, classical 0.017), so the stated interim level is stricter than O'Brien-Fleming there. The stated levels are therefore internally consistent with a valid two-look design, and the paper's label "O'Brien-Fleming" fits the interim value only at t = 0.5. Under either reading 0.0054 is the level the paper states for the interim analysis, and p = 0.039 does not meet it. The analysis itself used 150 of 198 patients (t = 0.76). Recalculated at t = 0.76, the interim level is 0.024 (classical O'Brien-Fleming: 0.021). Measured by events it is at most 0.024. The reported p = 0.039 exceeds all of these. It would meet an O'Brien-Fleming-type interim level only at t = 0.90 or later.
- One-sided testing. This does not account for the numbers. The paper states that all p values were two-sided, and the one-sided p (0.020) also exceeds 0.0054.
- A different test or rounding. This does not account for the numbers. The Wald p recomputed from the printed HR and CI (0.040) matches the reported 0.039. All rounding of the inputs gives 0.034–0.047. Table 3 reports p = 0.035 for the identical HR and CI, and crude χ², Yates and Fisher tests on the counts give 0.025–0.039. None is below 0.0054.
- The full-cohort sensitivity analysis supersedes the interim result. This does not account for the numbers. Table S2's analysis of all 198 patients (HR 0.59, 0.36–0.95, p = 0.029) is a second look at incompletely followed data, not the final analysis, and it is also above 0.0054. The paper presents it as confirming the interim result, not as a test at a different level.
- The interim analysis was for safety or for planning, so efficacy significance was not claimed. This does not account for the text. The Abstract, Introduction, Results and Discussion all state the efficacy finding as significant or "clearly" shown.
- Conversion or typesetting error in the archived text. This is excluded. The publisher-supplied JATS XML in Europe PMC and the publisher's supplementary PDF carry the same values: p = 0.039 in a separate table cell, and α = 0.0054 in both the STAR Methods and Data S1/Methods S1.
Status
- Version of record. The publisher pages (cell.com, sciencedirect.com) returned HTTP 403 to automated access, and doi.org resolves to an Elsevier redirect stub. I therefore compared the PMC-archived text with the publisher-supplied JATS XML in Europe PMC (PMC7462457) and with the publisher's Supplemental Information PDF (mmc1.pdf, "Cell, Volume 183 Supplemental Information"). All quoted sentences and table values agree. Every quotation above was confirmed verbatim against the PMC-archived text with
src/show.py. - Supplements. Document S1 (mmc1.pdf), the only supplementary item, holds Tables S1–S4 and Data S1/Methods S1. Data S1/Methods S1, the statistical plan for the interim analysis (supplement p. 3), repeats "a=0.0054 at interim and a=0.0492 at final". Table S2 gives the interim analysis (33/78 vs 18/72, HR 0.55, 0.31–0.97, p = 0.035) and all 198 patients (41/98 vs 27/100, HR 0.59, 0.36–0.95, p = 0.029). Nothing in the supplement states that the interim threshold was met, revised or abandoned.
- Corrections and comments. As of 2026-10-24 I found no correction, erratum, expression of concern or retraction. Crossref lists no update relations for the DOI (its only relation is a Faculty Opinions review), and PMC and Europe PMC list no correction notices. A web search for comments on the trial's interim threshold found none. The PubPeer API refused automated access (HTTP 403), so PubPeer could not be checked directly. The ClinicalTrials.gov record (NCT03296423) lists the trial as completed, has no posted results, and lists no results publication other than this paper.
- Sources. PMC article PMC7462457; Europe PMC full-text XML and supplementary-files bundle for PMC7462457; Crossref; ClinicalTrials.gov API record NCT03296423.
Suggested correction
- State in the Abstract and Results that the interim primary-outcome result (HR 0.55, 95% CI 0.31–0.97, p = 0.039) did not meet the interim significance level of α = 0.0054 that the STAR Methods state. Replace "significantly increased the time to first infection" and "statistically significant hazard ratio" with wording that reports the estimate as nominally significant at 0.05 but not at the interim boundary.
- Report the interval at the interim level (about 0.24–1.24) alongside the 95% CI for the primary outcome, or state the boundary explicitly next to each efficacy p value in Table 2 and Table 3.
- Qualify the Abstract's conclusion ("can protect the elderly against infections") and the Introduction's "clearly showed protection" accordingly. Note that the viral-respiratory result (p = 0.013) and the stepwise Cox result (p = 0.048) also do not meet the interim level, and that only "all respiratory infections" (p = 0.002) and patient-infections per year (p = 0.003) do.
- State the information fraction and spending rule behind the interim level. The stated pair (0.0054 / 0.0492) preserves the overall α for a look at about 70% of the information, but an O'Brien-Fleming-type boundary at that fraction would be about 0.02, and 0.0054 alone matches O'Brien-Fleming only at about 50%. Give the boundary that applies to the look actually performed (150 of 198 patients, at most 75% of events); no boundary recomputed here for that look (0.021–0.024) is met by p = 0.039.
- Minor: reconcile the p value for the identical primary estimate (0.039 in Table 2, 0.035 in Table 3 and Table S2) or name the test behind each.
- Report the final analysis of all 198 patients against the stated final level (α = 0.0492), which is consistent with an interim look at 0.0054 at about 70% of the information.