← Back to the plain-language case
SIR and SMR confidence intervals are 34–42 times too narrow for the observed counts
J Hepatol (2020) · doi:10.1016/j.jhep.2020.07.040 · PMC7395653
Summary
The paper compares 111 COVID-19 cases and 20 deaths among 13,255 Spanish liver transplant (LT) recipients with the age- and gender-matched general population. It reports a standardised incidence ratio (SIR, ×100) of 191.22 (95% CI 190.28–192.16) and a standardised mortality ratio (SMR, ×100) of 95.55 (95% CI 94.25–96.85), with intervals of the same width for the over-60 subgroup. The Methods say the intervals treat the observed count as Poisson. With 111 cases and 20 deaths that method gives 157.3–230.3 for the SIR and 58.4–147.6 for the SMR. Every other standard method computed from the paper's own strata gives a similarly wide interval. The published widths instead correspond to Poisson counts of about 153,000–159,000 and 20,750 events. Supplementary Table S2 shows where the SMR width comes from: a projected count of 20,741 deaths, obtained by applying the LT stratum case-fatality to the general population's cases. The SIR still exceeds 100 once corrected. The SMR interval, however, includes 100. The paper's repeated statement that LT recipients' mortality is lower than in the matched general population, and its suggestion that immunosuppression may be protective, therefore lack statistical support in its own data.
What the paper reports
Patients and methods, "Data sources, calculation of standardised ratios, and statistical analysis":
Expected incidence and outcomes in LT patients were obtained from the numbers observed in the general population, after balancing for age and gender. Ninety-five percent confidence intervals (95% CI) were calculated under the assumption that the number of cases observed followed a Poisson distribution.
Abstract, Results:
A total of 111 liver transplant patients were diagnosed with COVID-19 (SIR = 191.2 [95% CI 190.3–192.2]).
The mortality rate was 18%, which was lower than in the matched general population (SMR = 95.5 [95% CI 94.2–96.8]).
Results, "Standardised incidence of COVID-19 in LT patients":
After adjusting for age and gender, the number of observed cases almost doubled the expected number of cases (Table S1) thus resulting in a standardised incidence ratio of 191.22 (95% CI 190.28–192.16). In the subset of patients older than 60 years, the standardised incidence ratio was even higher (206.48; 95% CI 205.45–207.52).
Results, "Standardised mortality ratio of COVID-19 in LT patients":
After adjusting for age and gender, the number of observed deaths among LT patients was slightly lower than the expected number of deaths (Table S2), thus resulting in a standardised mortality ratio of 95.55 (95% CI 94.25–96.85).
Adjusted mortality rates in patients older than 60 were similar in LT recipients and in the general population (standardised mortality ratio = 100.29; 95% CI 98.93–101.66).
Supplementary Tables S1 and S2 (mmc1.pdf) print the following at the foot of each table:
Observed 280,501; Expected 146,690 … 191.22 (95%CI 190.28-192.16)
Observed 20,741; Expected 21,707 … 95.55 (95%CI 94.25-96.85)
The conclusions that rest on the SMR interval. From the Abstract, Conclusions:
Being chronically immunosuppressed, liver transplant patients have an increased risk of acquiring COVID-19 but their mortality rates are lower than the matched general population.
From the Lay summary:
In liver transplant patients, chronic immunosuppression increases the risk of acquiring COVID-19 but it could reduce disease severity.
From the Highlights:
Mortality rates are lower than those observed in the matched general population.
From the Discussion:
we demonstrated that standardised mortality rates were actually lower in LT patients as compared with the general population
From the Discussion, concluding paragraph:
Mortality rates were lower than those observed in the age- and gender-matched general population, thereby suggesting that chronic immunosuppression could exert a certain protective effect against the most severe forms of COVID-19.
What the paper's own numbers show
Method. All ratios are written ×100, as in the paper. I recomputed each interval in three ways.
- The stated method. I took the observed count O (111 cases, 92 cases over 60 from Table S1, and 20 deaths, all over 60). The expected count E is implied by the reported ratio, E = O / (ratio/100). I then computed the exact (Garwood) Poisson 95% interval for O and divided it by E. Byar's approximation and the log-normal approximation agree to within about 3 units.
- Direct standardisation from the strata. I entered the 12 age × gender strata of Tables S1–S2 and checked how the point estimates were built. The published ratios are reproduced by direct standardisation: LT stratum rates are applied to the general-population structure, and the resulting projected count (the tables' "Observed" 280,501 and 20,741) is divided by the general-population count. For that estimator, the variance comes from the LT stratum counts, Σ(wᵢ²·xᵢ). I give log-scale intervals, plus Fay–Feuer gamma intervals as a sensitivity check.
- Indirect standardisation from the same strata, i.e. the conventional SIR/SMR (O/E, with E taken from the general-population stratum rates), with exact Poisson intervals.
Finally, I asked which Poisson count would produce each published width: N = (1.96 × ratio / half-width)².
Every number below is printed by recompute.py.txt.
| Quantity | Location | Reported | Recomputed from the paper's numbers |
|---|---|---|---|
| Crude LT incidence | Results | 837.41 per 10⁵ (111 of 13,255) | 837.42 per 10⁵ |
| SIR point estimate | Abstract; Results; Table S1 | 191.22 ("Observed 280,501; Expected 146,690") | Direct standardisation from the strata: projected 280,556 cases / 146,690 = 191.26 |
| SIR, 95% CI | Abstract; Results; Table S1 | 190.28–192.16 (half-width 0.49% of the estimate) | Stated method (O = 111, E = 58.05): 157.3–230.3, 39 times as wide. Direct standardisation: 142.0–257.7 (Fay–Feuer 138.5–271.9). Indirect: 177.9 (146.3–214.2) |
| SIR >60, point and 95% CI | Results | 206.48 (205.45–207.52) | Stated method (O = 92, E = 44.56): 166.5–253.2, 42 times as wide. Direct: 206.61 (160.1–266.6; Fay–Feuer 157.3–269.7). Indirect: 194.9 (157.1–239.0) |
| SMR point estimate | Abstract; Results; Table S2 | 95.55 ("Observed 20,741; Expected 21,707") | Projected deaths 20,740.75 / 21,707 = 95.55 |
| SMR, 95% CI | Abstract; Results; Table S2 | 94.25–96.85 | Stated method (O = 20, E = 20.93): 58.4–147.6, 34 times as wide, includes 100. Direct: 57.8–158.0 (Fay–Feuer 53.7–310.3). Indirect: 97.3 (59.5–150.3) |
| SMR >60, point and 95% CI | Results | 100.29 (98.93–101.66) | 20,740.75 / 20,681 = 100.29. Stated method (O = 20, E = 19.94): 61.3–154.9. Direct: 60.7–165.8. Indirect: 99.3 (60.6–153.3) |
| Poisson count implied by each published width | derived | — | SIR 158,967; SIR >60 152,887; SMR 20,753; SMR >60 20,737 (the observed counts are 111, 92, 20, 20) |
| Published SMR intervals, reproduced | Table S2 | 94.25–96.85; 98.93–101.66 | Poisson on the projected 20,741 deaths: 94.25–96.85 and 98.93–101.65 |
| Published SIR >60 interval, reproduced | Results | 205.45–207.52 | Poisson on the projected >60 count (152,770): 205.44–207.52 |
| Published overall SIR interval | Table S1 | 190.28–192.16 | Not reproduced exactly. Poisson on 280,501 gives 190.51–191.93; on the 146,690 general-population cases, 190.24–192.20 |
Three of the four published intervals are reproduced, to within rounding, by treating a projected population-scale count as if it were the observed Poisson count. The fourth (overall SIR) has the same order of width. Its exact source could not be identified, but it corresponds to roughly 159,000 events. In every case the actual information is 111 cases or 20 deaths.
Two smaller inconsistencies in the supplement, neither of which changes any conclusion:
- In Table S1 the general-population strata sum to 48,640,775, while the printed overall population is 47,026,208. The printed crude incidence of 311.93 per 10⁵ uses the latter.
- In Table S2 the general-population deaths sum to 21,717, which matches the Results text. The SMR, however, uses "Expected 21,707": 20,741/21,707 = 95.55, while 20,741/21,717 = 95.50.
Figure
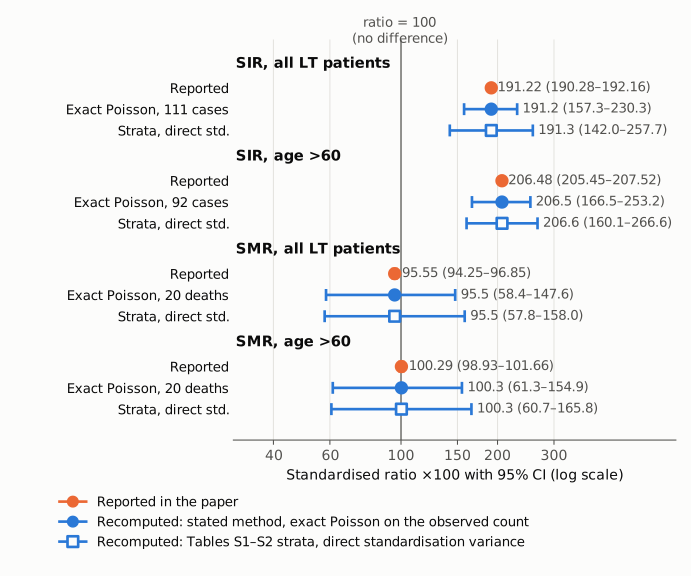
Figure 1. Reported and recomputed 95% confidence intervals for the four standardised ratios (×100), on one log-scale axis. The thin vertical line marks a ratio of 100, meaning no difference from the matched general population. Orange shows the values printed in the paper; their intervals are narrower than the marker. Filled blue shows the paper's stated method: an exact Poisson interval for the observed count (111 cases, 92 cases over 60, 20 deaths), scaled by the expected count implied by the reported ratio. Open blue squares show the interval for the directly standardised ratio, computed from the 12 strata in Supplementary Tables S1–S2 with the variance of the LT stratum counts. Both recomputations of the SIR stay above 100. Both recomputations of the SMR, overall and over 60, include 100.
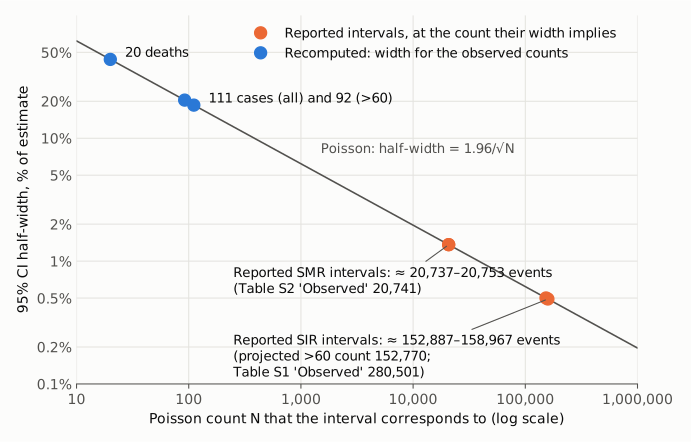
Figure 2. Where the published widths come from. The gray line is the relation between a Poisson count N and the relative half-width of its 95% interval, 1.96/√N. Each reported interval (orange) is placed at the count its width implies: about 20,750 events for both SMR intervals and 152,887–158,967 events for the SIR intervals. Those values match the projected counts printed or implied in Tables S1–S2 (20,741 deaths; 152,770 cases over 60). The counts actually observed (blue) are 111 and 92 cases and 20 deaths. For these, the relative half-width is about 18–20% for the SIRs and about 44% for the SMR.
Why it matters
The incidence finding survives correction. The corrected SIR is about 1.9, with a 95% CI of about 1.57–2.30 under the stated method and about 1.42–2.58 for the directly standardised estimator. That still shows a higher incidence among LT recipients. The paper overstates its precision by a factor of about 40, but the direction and significance of the result do not change.
The mortality finding does not survive. Under every method computed here, the SMR interval runs from about 54–60 to 148–310, so it is consistent with mortality anywhere from roughly 40% lower to substantially higher than in the matched general population. The over-60 SMR, which the paper itself describes as "similar", has an interval of about 61–155. In short, 20 deaths against about 21 expected cannot distinguish LT recipients from the matched population.
The statement that mortality is "lower than in the matched general population" appears in five places: the Abstract Results, the Abstract Conclusions, a Highlight, the Discussion ("we demonstrated that standardised mortality rates were actually lower") and the concluding paragraph. The concluding paragraph uses it to suggest that "chronic immunosuppression could exert a certain protective effect", and the Lay summary says that immunosuppression "could reduce disease severity". These statements rest on an interval (94.25–96.85) that excludes 100 only because its variance comes from a projected count of 20,741 rather than from the 20 deaths observed. The paper is a widely cited early report on COVID-19 in transplant recipients (Europe PMC lists 260 citing records), so the unsupported claim about mortality and immunosuppression could have reached clinical readers.
Explanations considered
- Ratios written ×100. 191.22 means 1.9122. Scaling changes the point estimate and the interval in proportion, so it leaves the relative width (0.49%) unchanged. It does not explain the narrow intervals.
- A typographical or rounding slip. All four intervals are affected. The pattern is consistent across them, and three of the four are reproduced to within 0.01 by a single calculation (Poisson on a projected count). This is a systematic method choice, not a slip.
- Text conversion error. The same values appear in the PMC text, the Europe PMC XML and the publisher's typeset supplement PDF (mmc1.pdf), so a conversion error is ruled out.
- The interval reflects only the uncertainty of the general-population reference rates. That uncertainty is small, because the general population had 146,690 cases. But the Methods say the interval is based on the observed count being Poisson. Also, the published SMR width matches the projected LT count (20,741), not the general-population deaths (21,717). An interval that ignores the variability of the 111 or 20 LT events does not describe uncertainty in the LT ratio in any case.
- Direct rather than indirect standardisation. The point estimates are directly standardised, although the Methods' wording and the labels "Observed/Expected" suggest an indirect SIR/SMR. A directly standardised ratio has a valid variance, Σ(wᵢ²·xᵢ) over the LT strata. Computed from Tables S1–S2, that variance gives intervals wider than the stated-method intervals (Figure 1). The indirect version gives similar intervals (SIR 146.3–214.2, SMR 59.5–150.3). Neither choice yields intervals of ±0.5%–1.4%.
- A different confidence level. At these counts, the published widths correspond to confidence levels of about 4–5% (3.8%–4.9%), and the paper says 95% throughout.
None of these explanations accounts for the numbers.
Status
As of 2026-10-23:
- Version of record. The publisher's site (sciencedirect.com and journal-of-hepatology.eu) returned HTTP 403, and doi.org redirects only to a linkinghub stub. I therefore checked the publisher-deposited text in PubMed Central and Europe PMC. Both carry the values quoted above. Crossref lists the article as J Hepatol 2021;74(1):148–155; it was published online in 2020.
- Supplement. The publisher's supplement mmc1.pdf (md5 05e647ab36152f45688c49925b4052af, from the Europe PMC supplementary-files archive) prints the same SIR and SMR intervals under Tables S1 and S2. It also gives the stratum data used for every recomputation here.
- Corrections. Crossref update records, PMC notices and Europe PMC notices list no correction, erratum or retraction (
src/known.py, run 2026-10-23). - Published discussion. The 260 citing records listed in Europe PMC were screened by title. One letter in J Hepatol 2021 ("Age and comorbidity are central to the risk of death from COVID-19 in liver transplant recipients", PMC7863751) and the authors' reply (doi:10.1016/j.jhep.2021.04.005, PMC8056821) were found. An earlier check of both texts in this pipeline found that they discuss age, comorbidity and mycophenolate, not the SIR or SMR intervals.
- PubPeer. pubpeer.com returned HTTP 403 (Cloudflare) on 2026-10-23. Web searches for the DOI and title together with PubPeer, erratum or correction, run earlier in this pipeline, found no thread. A further web search could not be run today.
Sources: the PMC article (PMC7395653); the Europe PMC full-text XML and supplementary files for PMC7395653; Crossref metadata for doi:10.1016/j.jhep.2020.07.040; the Europe PMC citations list for PMID 32750442.
Suggested correction
- Recompute the four intervals from the observed counts, as the Methods describe: SIR 191.22 (95% CI about 157–230); SIR >60 206.48 (about 167–253); SMR 95.55 (about 58–148); SMR >60 100.29 (about 61–155). An alternative is to report the directly standardised ratios with intervals based on the LT stratum counts (about 142–258, 160–267, 58–158 and 61–166).
- State that LT recipients' COVID-19 mortality did not differ significantly from that of the age- and gender-matched general population. Revise the Abstract Results and Conclusions, the second Highlight, the Lay summary and the Discussion to match, and remove or clearly label as speculative the inference that chronic immunosuppression may be protective.
- Describe the standardisation actually used (direct, with LT stratum rates applied to the general-population structure) and relabel the "Observed" and "Expected" entries in Tables S1–S2 as projected and reference counts.
- Reconcile the Table S1 population total (strata sum 48,640,775 against 47,026,208 printed) and the Table S2 denominator (21,707 against 21,717 deaths).