← Back to the plain-language case
Paper states a 69% hospitalization reduction; its own hazard and risk ratios imply about 40%
JAMA Netw Open (2020) · doi:10.1001/jamanetworkopen.2020.6445 · PMC7265099
Summary
In three places (the Abstract, the Results and the first paragraph of the Discussion), this randomized trial of social-needs navigation says that children in the navigator group were "69% less likely to be hospitalized", or had a "69% reduced risk", than children in the active control group. The paper's own estimates do not support that figure. The hazard ratio quoted alongside it, 0.59 (95% CI 0.38-0.94), means a 41% lower hazard, and the relative risk of 0.60, which recomputes exactly from the reported counts of 29/637 vs 50/663, means a 40% lower risk. A 69% reduction would require a ratio of 0.31, which lies outside every confidence interval the paper reports for this outcome. The direction and statistical significance of the finding are unaffected, but the headline size of the effect is overstated by about 1.7 times, in a paper that ties its conclusions to return-on-investment and cost-saving arguments.
What the paper reports
Abstract, Results (as archived in PMC; "05% CI" is in the original):
Children enrolled in the in-person navigator group had a decreased risk of hospitalization within 12 months (hazard ratio, 0.59; 05% CI, 0.38-0.94; P = .03), making them 69% less likely to be hospitalized.
Results, "Acute Care Utilization by Navigation Intervention and Active Control Group", third paragraph:
Using Cox proportional hazard regression, we found that during the study follow-up period, children enrolled in the navigator intervention group had a decreased risk of being hospitalized (hazard ratio, 0.59; 95% CI, 0.38-0.94; P = .03), making them 69% less likely to be hospitalized than children in the active control group.
Discussion, first paragraph:
We found that during the 12 months after study enrollment, children enrolled in the trial’s patient navigator intervention had a 69% reduced risk of hospitalization than children in the active control group, but the intervention had no effect on ED visits. This translated to only 4.6% of patient navigator families having their child hospitalized vs 7.5% among the active control group.
Results, same section, first paragraph (the raw counts and relative risk):
However, significantly fewer children from the in-person navigation group (29 [4.6%]) were admitted to the hospital during the year following enrollment compared with children from the active control group (50 [7.5%]; risk difference, -3.0%; 95% CI, -5.6% to -0.4%; relative risk, 0.60; 95% CI, 0.39 to 0.94).
Table 2, row "Hospitalized within 1 y": Model 1 (unadjusted, N = 1300) HR 0.59 (0.38-0.94), P = .03; Model 2 (adjusted for child, caregiver and site covariates) HR 0.56 (0.35-0.90), P = .02; Model 3 (additionally adjusted for poverty, n = 1116) HR 0.59 (0.35-0.99), P = .046.
The title, Key Points, abstract Conclusions and Table 2 give only the direction of the effect or the correct ratios; none of them uses the 69% figure.
What the paper's own numbers show
Method. Every effect measure is a ratio of the navigator group to the active control group, so the percentage reduction it implies is 1 − ratio, and the 95% CI converts the same way (1 − upper bound to 1 − lower bound). I applied this to the three Table 2 hazard ratios and to the relative risk. I recomputed the relative risk, risk difference and an odds ratio from the 2×2 counts given in the Results (Wald intervals on the log scale for ratios), and recovered P values from the printed CIs as a consistency check. I then looked for any quantity the paper reports, or that its numbers allow, that equals 69%. Every number below is printed by recompute.py.txt.
| Quantity | Location | Reported | Recomputed from the paper's own numbers |
|---|---|---|---|
| Stated reduction in hospitalization | Abstract; Results para 3; Discussion para 1 | "69% less likely" / "69% reduced risk" | — |
| Hospitalized, navigator group | Results para 1; Discussion | 29/637 (4.6%) | 4.55% |
| Hospitalized, active control | Results para 1; Discussion | 50/663 (7.5%) | 7.54% |
| Risk difference (95% CI) | Results para 1 | −3.0% (−5.6% to −0.4%) | −2.99 points (−5.6 to −0.4); agrees |
| Relative risk (95% CI) | Results para 1 | 0.60 (0.39-0.94) | 0.604 (0.39-0.94); agrees. 39.6% lower risk (5.9% to 61.3%) |
| Odds ratio (95% CI) | not reported | — | 0.585 (0.37-0.94); 41.5% lower odds (6.3% to 63.5%) |
| Cox HR, Model 1, unadjusted | Abstract; Results para 3; Table 2 | 0.59 (0.38-0.94), P = .03 | 41% lower hazard (6% to 62%); P from CI = 0.022 |
| Cox HR, Model 2, adjusted | Table 2 | 0.56 (0.35-0.90), P = .02 | 44% lower hazard (10% to 65%); P from CI = 0.016 |
| Cox HR, Model 3, + poverty | Table 2; Results para 3 | 0.59 (0.35-0.99), P = .046 | 41% lower hazard (1% to 65%); P from CI = 0.047 |
| Ratio needed for a 69% reduction | — | — | 0.31; outside all three HR CIs and the RR CI |
| Hospitalizations per child, ratio | Results para 1 | 35 vs 55 total; means 0.05 vs 0.08 | (35/637)/(55/663) = 0.662 (33.8% fewer); 0.05/0.08 = 0.625 (37.5% fewer) |
| Inverse of Model 1 HR | derived | — | 1/0.59 = 1.695: the control group's hazard is 69% higher |
All the paper's printed ratios recompute correctly from its counts and CIs; the only figure that does not follow from them is the 69%. Across every measure the reduction is 34% to 44%, and the upper ends of the converted 95% CIs reach 61% to 65%, short of 69%. The single piece of arithmetic on the paper's numbers that yields 69% is 1/0.59 − 1 = 0.69, which describes how much higher the control group's hazard is than the navigator group's. It is not the navigator group's reduction (that is 1 − 0.59 = 0.41), because a ratio's reciprocal changes which group is the reference.
Figure
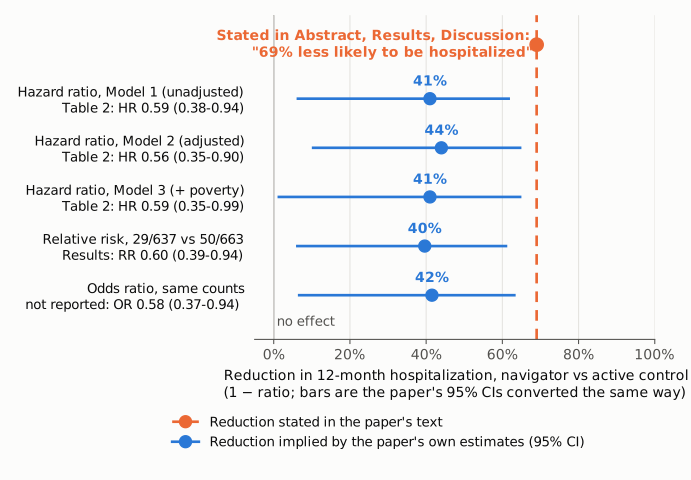
Figure 1. Percentage reduction in 12-month hospitalization for the navigator group relative to the active control group. The orange dot and dashed line mark the 69% stated in the Abstract, Results and Discussion. Blue dots are the reductions implied by the paper's own estimates (1 − ratio): the three Cox hazard ratios from Table 2, the relative risk from the Results (recomputed from 29/637 vs 50/663), and an odds ratio from the same counts, which the paper does not report. Blue bars are the corresponding 95% CIs converted the same way; for the hazard ratios and relative risk these are the paper's printed intervals. The thin line at 0% marks no effect. The axis runs from 0% to 100% reduction.
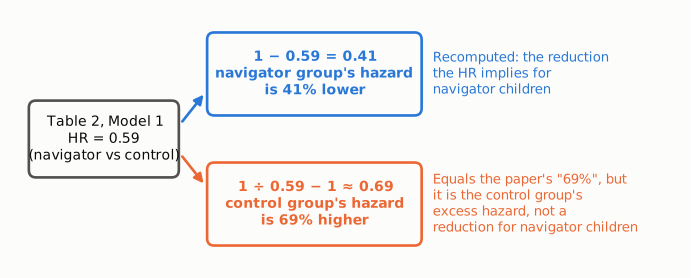
Figure 2. The hazard ratio of 0.59 compares the navigator group with the control group. Subtracting it from 1 (blue) gives the navigator group's reduction, 41%. Taking its reciprocal and subtracting 1 (orange) gives 0.69, the figure printed in the paper, but that quantity is the control group's excess hazard relative to the navigator group, a statement with the reference group reversed.
Why it matters
- The headline effect size is overstated in the most-read parts of the paper. The 69% figure appears in the Abstract and is repeated in the Results and the opening of the Discussion. Readers who take the effect size from those sentences receive a reduction about 1.7 times the one the data support (69% vs about 41%). The figure has been repeated in press coverage of the trial.
- The conclusions lean on the size of the effect. The Discussion says the findings "should inform health systems’ calculations on the return on investment of different social care programs", citing an average cost of "$13 400" per nonbirth pediatric hospitalization, and the Conclusions say such programs "could potentially result in large reductions in inpatient stays and associated cost savings". Any savings estimate built on a 69% reduction would be inflated by a factor of about 1.7 relative to the paper's own hazard ratio.
- What is not affected. The direction and significance of the hospitalization effect stand (P = .03 unadjusted, P = .046 fully adjusted, Pearson χ² P = 0.024 from the counts). The absolute risk difference, −3.0 percentage points (4.6% vs 7.5%), is reported correctly, as are all hazard ratios, the relative risk and the null finding for ED visits (HR 0.96).
Explanations considered
- A different model or adjustment. Does not account for it. The unadjusted, adjusted and poverty-adjusted hazard ratios imply 41%, 44% and 41% reductions. The sentence giving 69% is attached directly to the unadjusted HR 0.59 (0.38-0.94).
- A different effect measure. Does not account for it. The relative risk (0.60, 40% lower risk), an odds ratio from the same counts (0.585, 41.5% lower odds), the ratio of hospitalization counts per child (0.662, 33.8% fewer) and the ratio of mean hospitalizations (0.625, 37.5% fewer) all fall between 34% and 44%.
- The 4-month or multiple-imputation analyses in Supplement 2. Do not account for it. The 12-month multiple-imputation hazard ratios in eTable 3 are 0.61 (0.39-0.97), 0.60 (0.38-0.96) and 0.61 (0.38-0.96), implying 39-40% reductions. The 4-month hazard ratios in eTable 2 are 0.44, 0.43 and 0.40 (56-60% reductions), and their wide CIs do include 0.31; but the sentences giving 69% refer to hospitalization "within 12 months" or "during the study follow-up period" and quote the 12-month HR, and the paper describes the 4-month effects only as "similar". The supplement never uses the 69% figure.
- A confidence limit rather than the point estimate. Does not account for it. The most favorable converted limit of any 12-month estimate is 65% (Models 2 and 3), not 69%, and the sentence presents 69% as the effect, not as a bound.
- The reciprocal of the hazard ratio. Matches the number but not the statement. 1/0.59 − 1 = 0.69 means the control group's hazard was 69% higher than the navigator group's. That is a different claim from "navigator children were 69% less likely to be hospitalized", which would require HR 0.31. Nothing in the Methods, table footnotes or legends defines "less likely" in a way that would make the two equivalent.
- A text conversion or archiving artifact. Ruled out. The same three sentences appear identically on the publisher's version of record, the PMC HTML page and the Europe PMC full-text XML.
Two minor, unrelated inconsistencies were noticed and are not part of the claim. The abstract prints "05% CI" for 95% CI. The Results give P = .81 next to the unadjusted ED-visit HR of 0.96 (0.80-1.14), whereas Table 2 gives P = .62 for that model and .81 for Model 3; the CI implies P ≈ 0.65, consistent with Table 2.
Status
- Version of record. The publisher's article page (reached through the DOI at jamanetwork.com, checked 2026-10-24) contains the same three sentences, the same "05% CI" typo in the abstract, and the same Table 2 values as the PMC archive. Every quotation above was checked verbatim against the PMC-archived text with
src/show.py. - Supplements. The Europe PMC supplementary bundle holds Supplement 1 (trial protocol), Supplement 2 (eTables 1-3) and Supplement 3 (data sharing statement). Supplement 2 was read in full: its hospitalization hazard ratios are those quoted above and it does not use the 69% figure. No individual-level data are provided, so the Cox models could not be refitted.
- Corrections and comments. As of 2026-10-24 no correction, erratum, expression of concern or retraction was found.
src/known.pyreturns no Crossref update relations, no PMC notices and no Europe PMC notices, and the Crossref record has no update-to or updated-by entries. The PubMed record (PMID 32478849) links only to an invited commentary (doi:10.1001/jamanetworkopen.2020.6456), which cites the raw rates (about 5% vs 8%) and does not discuss the 69% figure. A PubMed erratum search returned no items, and neither the publisher nor the PMC page carries a correction notice. Web searches for a correction and for PubPeer or Retraction Watch coverage found nothing. Caveats: the Europe PMC search API returned HTTP 503 on every attempt, and PubPeer's API required human verification, so a PubPeer thread cannot be fully excluded. - Sources. PMC article PMC7265099; Europe PMC full-text XML and supplementary files for PMC7265099 (
jamanetwopen-3-e206445-s002.pdf); https://doi.org/10.1001/jamanetworkopen.2020.6445; Crossref; PubMed; PubPeer; web search.
Suggested correction
In the Abstract, replace
making them 69% less likely to be hospitalized.
with
corresponding to a 41% lower hazard of hospitalization.
In the Results ("Acute Care Utilization..."), replace
making them 69% less likely to be hospitalized than children in the active control group.
with
corresponding to a 41% lower hazard of hospitalization than children in the active control group.
In the Discussion, first paragraph, replace
had a 69% reduced risk of hospitalization than children in the active control group
with
had a 41% lower hazard of hospitalization (relative risk, 0.60, a 40% lower risk) than children in the active control group
The authors may also wish to correct "05% CI" to "95% CI" in the Abstract, and to give the ED-visit P value in the Results as P = .62 to match Table 2 Model 1.