← Back to the plain-language case
Combined odds ratio interval for HLA-C variant rs114598080 is incompatible with its p-value and components
PLoS Pathog (2020) · doi:10.1371/journal.ppat.1008565 · PMC7259797
Summary
The abstract, the Results text and Table 2 report the combined association of rs114598080 with leprosy as OR = 1.47 [1.46–1.48] with p = 8.77x10⁻¹³. An interval that narrow implies a test statistic of about z = 111 (about 75.5 under the interval convention the other rows of Table 2 follow, and no less than about 50 at any rounding), while p = 8.77x10⁻¹³ implies z = 7.15 and an interval of about [1.32–1.63]. The combined OR of 1.47 also lies below both of its components (discovery 1.85, replication 2.06). Pooling those two components gives about 1.97 [1.65–2.36], with p ≈ 6x10-14, close to the printed p-value. rs114598080 is one of the three independent HLA signals the abstract highlights. As printed, its effect size is probably too low and its precision is overstated about 10–15-fold in standard error (roughly 110–240 times in statistical information), depending on the interval convention.
What the paper reports
Abstract:
We identified three independently associated SNPs, two located in the HLA class I region (rs1265048: OR = 0.69 [0.58–0.80], combined p-value = 5.53x10⁻¹¹; and rs114598080: OR = 1.47 [1.46–1.48], combined p-value = 8.77x10⁻¹³), and one located in the HLA class II region (rs3187964 (OR = 1.67 [1.55–1.80], combined p-value = 8.35x10⁻¹⁶).
Results, "Replication study > Within the MHC region", third paragraph:
The rs114598080 SNP, located in a CTCF binding site (ENSR00000262841) 15.6 kb upstream of the HLA-C gene, gave a univariate p-value of 8.8x10⁻¹³ in the combined analysis, with an OR for developing leprosy for AG vs. GG (or AA vs. AG) of 1.47 [1.46–1.48].
Table 2, row rs114598080. The columns are: SNP, m/M, gene, MAF, then P value and OR [95% CI] for the discovery GWAS, the replication (one-tailed, "#") and the combined GWAS and replication sample:
rs114598080 (6:31255442) | A/G | HLA-C | 0.10 | 3.90x10-06 | 1.85 [1.39–2.44] | 4.39x10⁻¹¹ | 2.06 [1.7 –Inf] | 8.77x10⁻¹³ | 1.47 [1.46–1.48]
Table 2 footer (excerpt):
* with respect to the minor allele# one-tailed test
Materials and methods, "Statistical methods", first paragraph, on the combined analysis:
Conditional logistic regression was also used for a combined analysis of the discovery family and replication case-control samples. In this combined analysis, all cases and controls from the case-control study were grouped together in a stratum for analysis, in combination with the strata consisting of the affected offspring and their pseudosibs, as previously described [34, 35].
Results, same section, second paragraph, on the multivariable model:
We found that three SNPs (rs3187964, rs114598080 and rs1265048) were required to capture the full association signal in the HLA region (S7 Table).
The strength of association was much lower for rs114598080 (multivariable p-value = 3.75x10⁻⁵), and even lower for rs1265048, (multivariable p-value = 0.011).
What the paper's own numbers show
Method. For a Wald estimate, the 95% interval and the p-value both follow from the same standard error of the log OR. So each can be recovered from the other:
- From the interval: SE = (ln upper − ln lower) / (2 × 1.96) and z = ln OR / SE.
- From the p-value: z = Φ⁻¹(1 − p/2) and SE = ln OR / z.
The other four combined rows of Table 2 have intervals that are symmetric on the OR scale (for example 0.69 [0.58–0.80]). Read as OR ± 1.96·SE(log OR), they reproduce each row's printed p-value to within rounding. I therefore apply both the standard log-scale reading and this reading to rs114598080. Separately, I pool the SNP's discovery and replication estimates by inverse variance. Their SEs come from their printed intervals; the replication interval is a one-sided 95% bound, so its SE is (ln 2.06 − ln 1.7) / 1.645. Every number below is printed by recompute.py.txt.
| Quantity | Location | Reported | Recomputed |
|---|---|---|---|
| rs114598080 combined OR [95% CI] | Abstract; Results; Table 2 | 1.47 [1.46–1.48] | — |
| rs114598080 combined p | Abstract and Table 2 (8.77x10⁻¹³); Results (8.8x10⁻¹³) | 8.77x10⁻¹³ | — |
| SE(log OR) implied by the CI, log scale | from Table 2 | — | 0.00347 → z = 111.0, p ≈ 10^-2678 |
| Same log-scale reading, at the widest rounding [1.455–1.485] | from Table 2 | — | SE 0.00521 → z = 74.0, p ≈ 10^-1191 |
| Same, under the other rows' OR ± 1.96·SE reading | from Table 2 | — | SE 0.0051 → z = 75.5, p ≈ 10^-1240 |
| Same reading, at the widest rounding [1.455–1.485] | from Table 2 | — | SE 0.00765 → z = 50.3 at OR 1.47 (49.9 at OR 1.465), p ≈ 10^-542 |
| z and SE implied by the reported p | from Table 2 | p = 8.77x10⁻¹³ | z = 7.15, SE = 0.0539: 15.5x the interval's SE under the log-scale reading (241x less information), 10.6x under the OR ± 1.96·SE reading (112x), 7.0x at that reading's widest rounding (50x) |
| 95% CI implied by the reported p, at OR 1.47 | from Table 2 | [1.46–1.48] | [1.32–1.63] log scale; [1.36–1.58] under the OR ± 1.96·SE reading |
| Other four combined rows: |z| from p vs from CI (OR ± 1.96·SE reading) | Table 2 | — | 6.56 vs 6.61; 8.05 vs 8.04; 7.53 vs 7.46; 5.41 vs 5.36 (all agree) |
| Combined OR relative to its components | Table 2 | 1.47 vs discovery 1.85, replication 2.06 | outside both; the other four rows lie between their components |
| Discovery component | Table 2 | 1.85 [1.39–2.44], p 3.90x10-06 | SE 0.1435, z 4.29 |
| Replication component (one-sided bound) | Table 2 | 2.06 [1.7–Inf], one-tailed p 4.39x10⁻¹¹ | SE 0.1168, z 6.19 |
| Inverse-variance pool of the two components | from Table 2 | — | OR 1.97 [1.65–2.36], SE 0.0906, z 7.51, p ≈ 6.1x10⁻¹⁴ |
| Same, with the bound "1.7" read as 1.65 or 1.75 | from Table 2 | — | 1.96 [1.62–2.37], p 8x10-12; 1.99 [1.70–2.33], p 3.4x10⁻¹⁷ |
| SE implied by the reported p if the OR were 1.97 | from Table 2 | — | 0.0951 (pooled component SE 0.0906) |
| Rough allelic SE from sample size: 1803 cases, ≤ 2534 controls + pseudosibs | Abstract; Methods; MAF from Table 2 (0.10) or S5 Table (0.13) | — | 0.073 (MAF 0.10) or 0.065 (MAF 0.13); an SE of 0.0035 would need a sample about 350–440x larger |
Three things follow:
- The printed interval and the printed p-value cannot both be right. No rounding or interval convention brings the interval's z below about 50, and the p-value's z is 7.15.
- The printed OR of 1.47 cannot be a pooled estimate of 1.85 and 2.06. A common-OR likelihood that is the sum of the two parts has its maximum between the maxima of the two parts. All four other rows of Table 2 behave this way.
- The printed p-value fits the pooled components. Pooling gives z = 7.51 (p ≈ 6x10-14), against z = 7.15 printed. At an OR near 1.97, the printed p implies an SE of 0.095, close to the pooled SE of 0.091. This suggests that the p-value is correct and that the OR and its interval are not, although only the original model output can show which value is wrong.
Figure
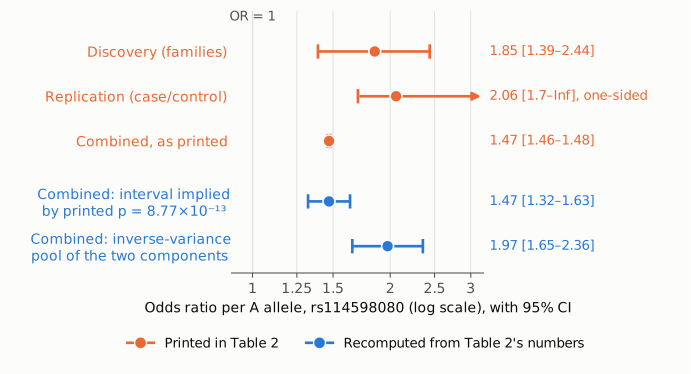
Figure 1. Odds ratios for rs114598080 on one log-scale axis; the thin vertical line marks OR = 1. Orange values are printed in Table 2: discovery 1.85 [1.39–2.44], replication 2.06 with a one-sided 95% lower bound of 1.7 (arrow = open upper end), and the combined estimate 1.47 [1.46–1.48], whose interval is barely wider than its marker. Blue values are recomputed from Table 2's own numbers by recompute.py.txt. The first is the 95% interval that the printed p = 8.77x10⁻¹³ implies around the printed OR, [1.32–1.63]. The second is the inverse-variance pool of the two printed components, 1.97 [1.65–2.36]. The printed combined estimate lies below both component point estimates, and its SE is about 10–15 times smaller than its own p-value allows (15.5x under a log-scale reading of the interval, 10.6x under the OR ± 1.96·SE reading the other rows follow).
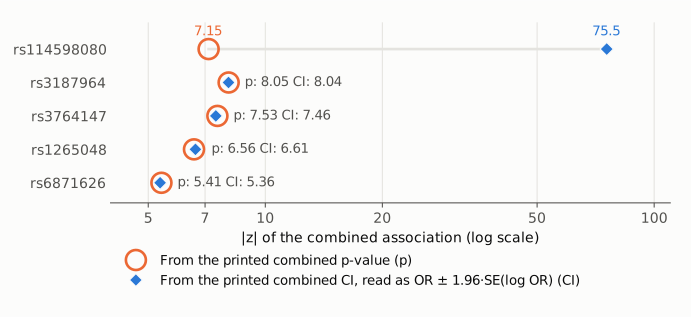
Figure 2. For each combined row of Table 2, the test statistic |z| implied by the printed combined p-value (orange ring) and by the printed combined interval read as OR ± 1.96·SE(log OR) (blue diamond), on a log axis. For four SNPs the two agree to within 0.07, so this reading of the intervals is consistent with the table. For rs114598080 the p-value gives 7.15 and the interval gives 75.5 (111 under a standard log-scale reading). All values are computed by recompute.py.txt from Table 2.
Why it matters
- It is a headline result. rs114598080 is one of the three independent HLA signals named in the abstract, and the abstract gives its effect as OR 1.47 [1.46–1.48]. That figure is likely to be carried into reviews, meta-analyses and fine-mapping comparisons across populations.
- The magnitude is probably understated. The paper's own component estimates point to a combined OR near 1.9–2.0, not 1.47.
- The precision is greatly overstated. The printed interval claims roughly 110–240 times the statistical information that the p-value supports (112x under the OR ± 1.96·SE reading, 241x under the log-scale reading). It is also far more than a sample of about 1800 cases could give at this allele frequency: an SE of 0.0035 would need a sample about 350–440 times larger. A meta-analysis that weights studies by the printed interval would give this estimate almost all the weight.
- What is not affected. The direction of the association (the A allele raises risk), its genome-wide significance, its replication in the case/control sample, and the conclusion that three SNPs capture the HLA signal all stand. That conclusion rests on the multivariable case/control model (rs114598080: multivariable p = 3.75x10⁻⁵, OR 1.64 [1.29–2.09] in S7 Table), not on the combined univariate estimate.
Explanations considered
- Rounding. Does not account for it. The widest endpoints that round to 1.46 and 1.48 (1.455 and 1.485) still give SE 0.0052 and z = 74 under the log-scale reading, and SE 0.0077 and z ≈ 50 (49.9 at OR 1.465) under the OR ± 1.96·SE reading. Both are far above the p-value's z of 7.15.
- A different interval convention (OR-scale symmetric, profile or score intervals). Does not account for it. The other four combined rows follow OR ± 1.96·SE(log OR) and match their p-values. Under that same rule rs114598080 gives z = 75.5. Profile and score intervals differ from Wald intervals only slightly at this sample size, not by a factor of 10–15 in width.
- A one-sided p-value. Does not account for it. The footer's "#" (one-tailed) marks only the replication columns, and a one-sided reading would move z only from 7.15 to 7.05.
- A different confidence level. Does not account for it. The column header says 95% CI. An interval as narrow as [1.46–1.48] at z = 7.15 would correspond to a confidence level of about 10%.
- A different contrast or genetic model. Does not account for it. The text describes the OR per minor allele ("AG vs. GG (or AA vs. AG)"), the same additive coding as the other rows. A different contrast would not explain why the interval is incompatible with the p-value from the same model.
- Different samples in the combined row. Not supported. The combined analysis uses the same discovery families and replication cases and controls as the other rows (Methods). The two components' SEs (0.14 and 0.12) cannot combine to anything below about 0.09.
- Different models for the components (FBAT and SNPTEST p-values versus conditional logistic regression in the combined analysis). Accounts for small differences only. The component p-values differ from their own intervals by about 0.3 in z, which is enough to blur the pooled p slightly but not to move a pooled OR from about 1.97 to 1.47, or an SE from about 0.09 to 0.0035.
- A conversion or typesetting artifact. Ruled out. The same numbers appear in the publisher's PDF (page 1 abstract, page 7 Table 2, page 8 Results), on the PLOS HTML page, in the PMC archive and in the medRxiv preprint abstract (doi:10.1101/2020.01.30.20018432).
Status
As of 2026-10-24:
- Version of record. I checked the publisher's PDF (journals.plos.org,
file?type=printable, 16 pages, text extracted with PyMuPDF). The abstract (p. 1), Table 2 (p. 7) and the Results text (p. 8) all read 1.47 [1.46–1.48]. The PLOS HTML page, PMC and Europe PMC agree, and so does the medRxiv preprint. - Supplements. S5 Table (HLA SNP statistics) and S7 Table (multivariable analysis), downloaded from the PLOS article page, give rs114598080 discovery p 3.9016x10-06, replication p 4.39264x10⁻¹¹ and replication OR "2.055 [1.7 - Inf[". S7 also repeats Table 2's discovery and replication univariate values and gives the multivariable OR 1.64 [1.29 -2.09]. Neither table reports the combined-sample OR or interval, and no model output for the combined analysis is published, so the supplements cannot settle which combined value is wrong.
- Corrections. Crossref lists only the publisher's "new version" record (2020-05-29) and the preprint relation. PMC and Europe PMC have no correction, expression of concern or retraction notice. The PLOS article page shows "Reader Comments (0)".
- PubPeer. The PubPeer search API required human verification and could not be queried directly. Web searches for the title, DOI and SNP returned no PubPeer entry.
Sources: PLOS article, PMC7259797, medRxiv preprint, Crossref REST API (relation.object and update records for the DOI).
Suggested correction
The authors would need to re-extract the combined conditional logistic regression output for rs114598080 and correct the OR and 95% CI in three places: the abstract, Table 2 (combined columns) and the Results text ("1.47 [1.46–1.48]"). They should also confirm the p-value of 8.77x10⁻¹³, which is consistent with the component estimates. Based on the paper's own numbers, the corrected estimate is expected near OR 1.9–2.0, with a 95% interval on the order of [1.65–2.36], rather than [1.46–1.48]. If the OR of 1.47 is in fact correct, the interval implied by the printed p-value would be about [1.32–1.63].
The same table has a second, smaller slip. The discovery interval for rs1265048 is printed as 0.63 [0.52–0.63], with the upper limit equal to the estimate, in both Table 2 and S7 Table. The printed p = 8.72x10-06 implies about [0.51–0.77], so the upper limit is probably about 0.76–0.77.